
Activity 8: Why is the history of urbanisation so important for understanding present-day Brussels?

There's a bit of Brussels for everyone!
Activity 8: Why is the history of urbanisation so important for understanding present-day Brussels?
To understand the city, it is necessary to grasp the diversity of the neighbourhoods that make it up. In order to do this, it is important to adopt a geohistorical, but also sociological interpretation and to relate it to the living conditions of its inhabitants. The division of the districts within the Brussels-Capital Region bears witness to spatial structures which have developed over the course of history and which have been changed more recently by new phenomena and urban planning initiatives.
In the second half of the 19th century, rapid industrial development required the construction of numerous new houses to provide a roof over the heads of thousands of workers in an already densely populated city. This led to a strong densification of the space, marked in particular by the construction of a large number of workers' dead-ends in the heart of the Pentagon. In these tiny alleyways, almost deprived of daylight, the workers crammed together in deplorable sanitary conditions which will be the object of strong criticism. These very poor working-class neighbourhoods in the heart of the city did not fit in well with the image of the big modern city that Brussels wanted to portray.
To give you an idea of the urban density in the Pentagon, look carefully at the map below, it shows you the many dead-ends, blocks and working-class districts that coexisted in the heart of the Pentagon in the mid-1860s. The transformations of the city centre and the strong real estate pressure led to an increase in the value of these plots of land and gradually drove out their occupants for the construction of new buildings. This explains why these dead ends have now almost disappeared from the urban landscape.
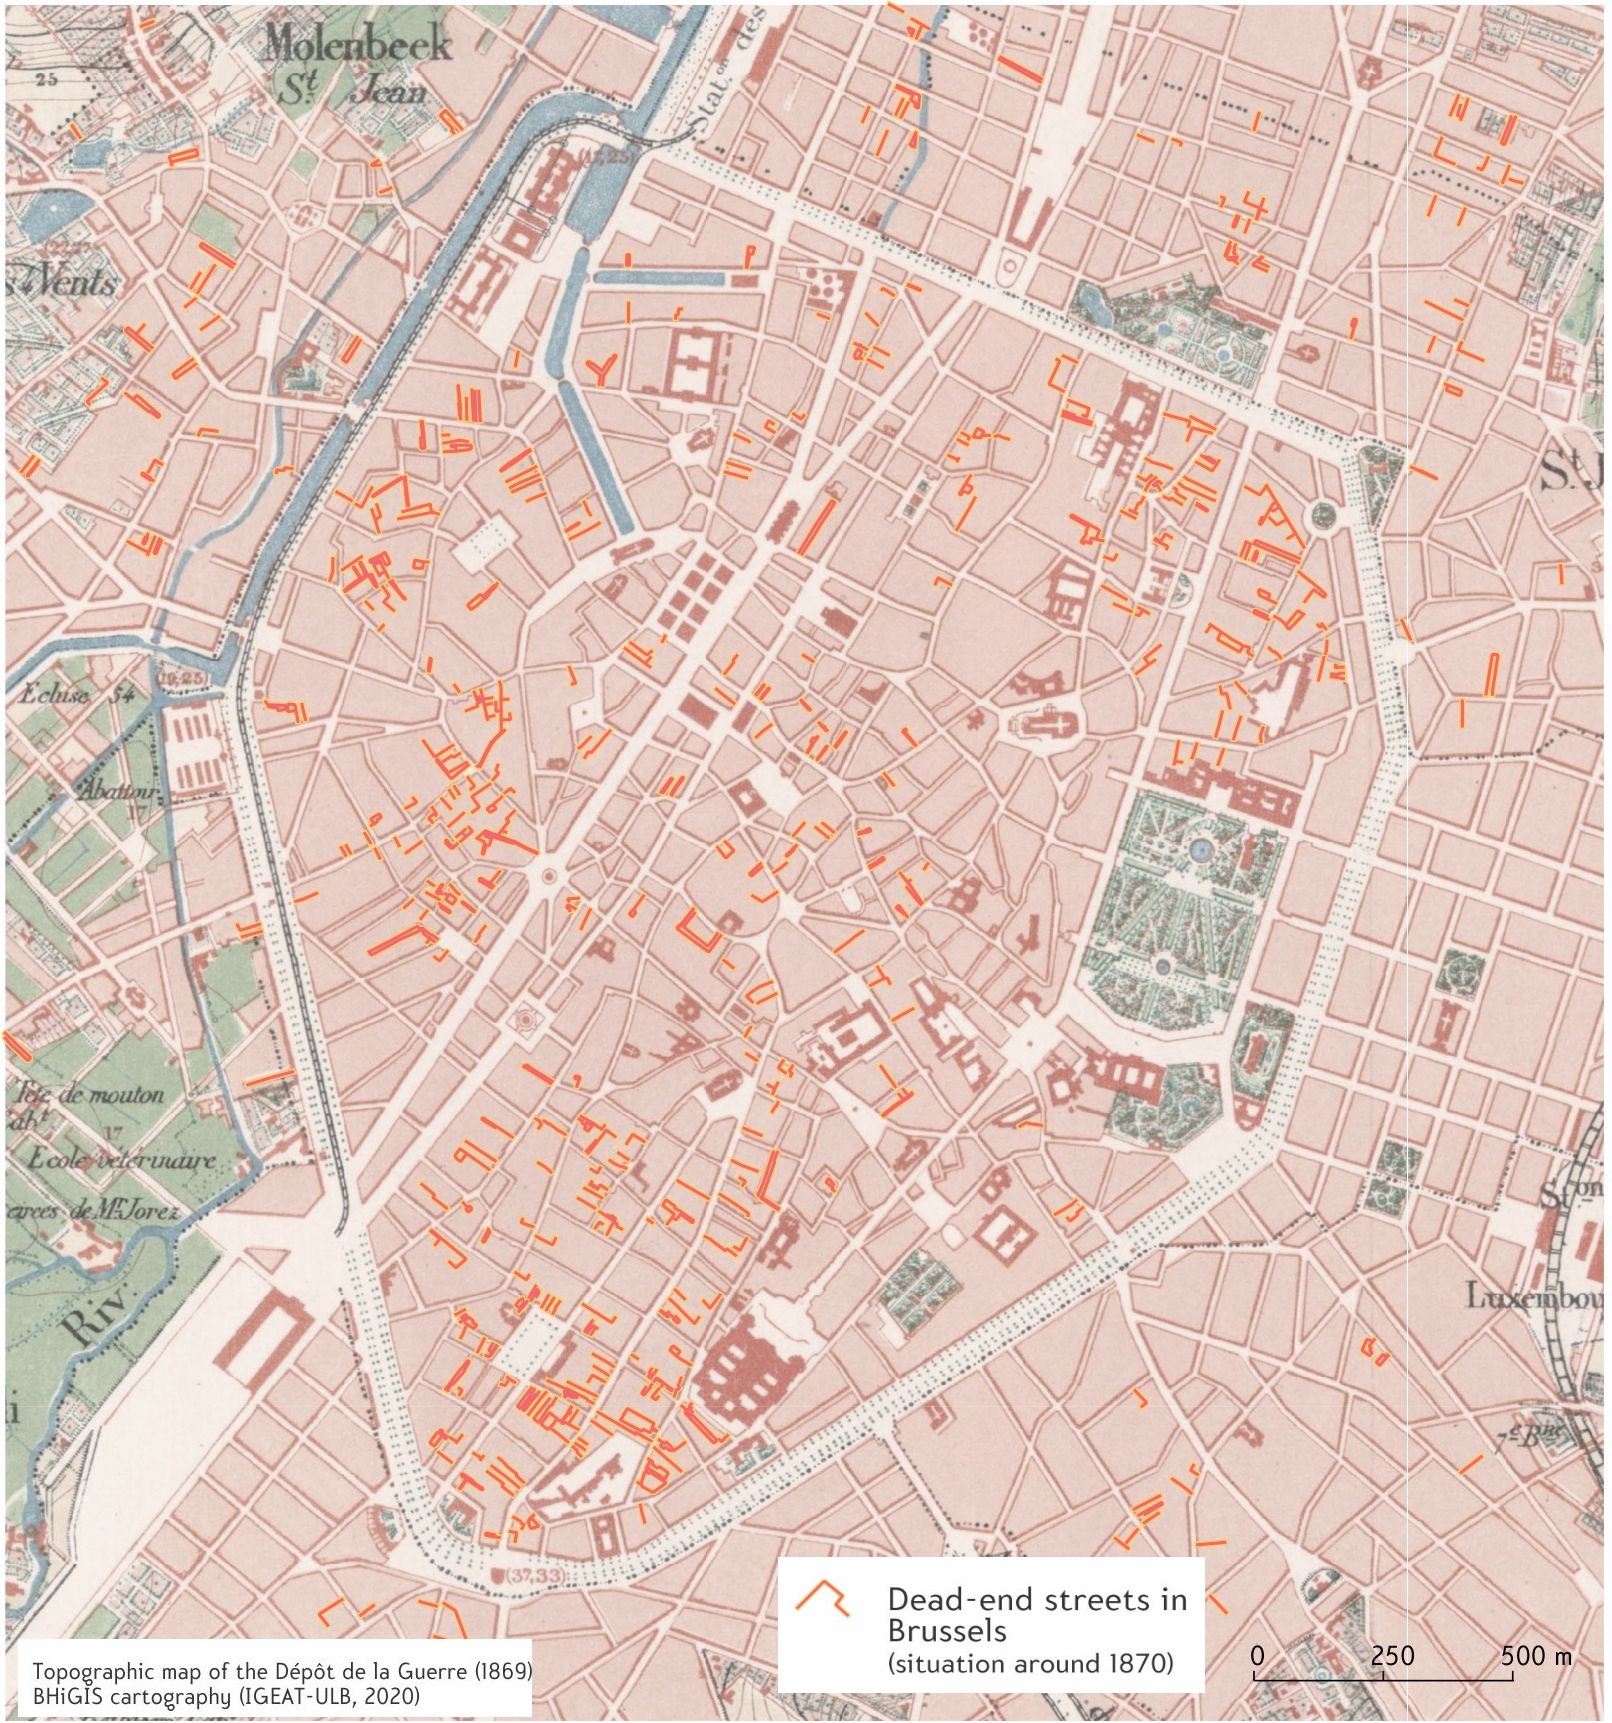 The dead-ends, blocks and working-class districts in the pentagon around 1870.
© Christian Dessouroux.
The impact of house prices on residential choices
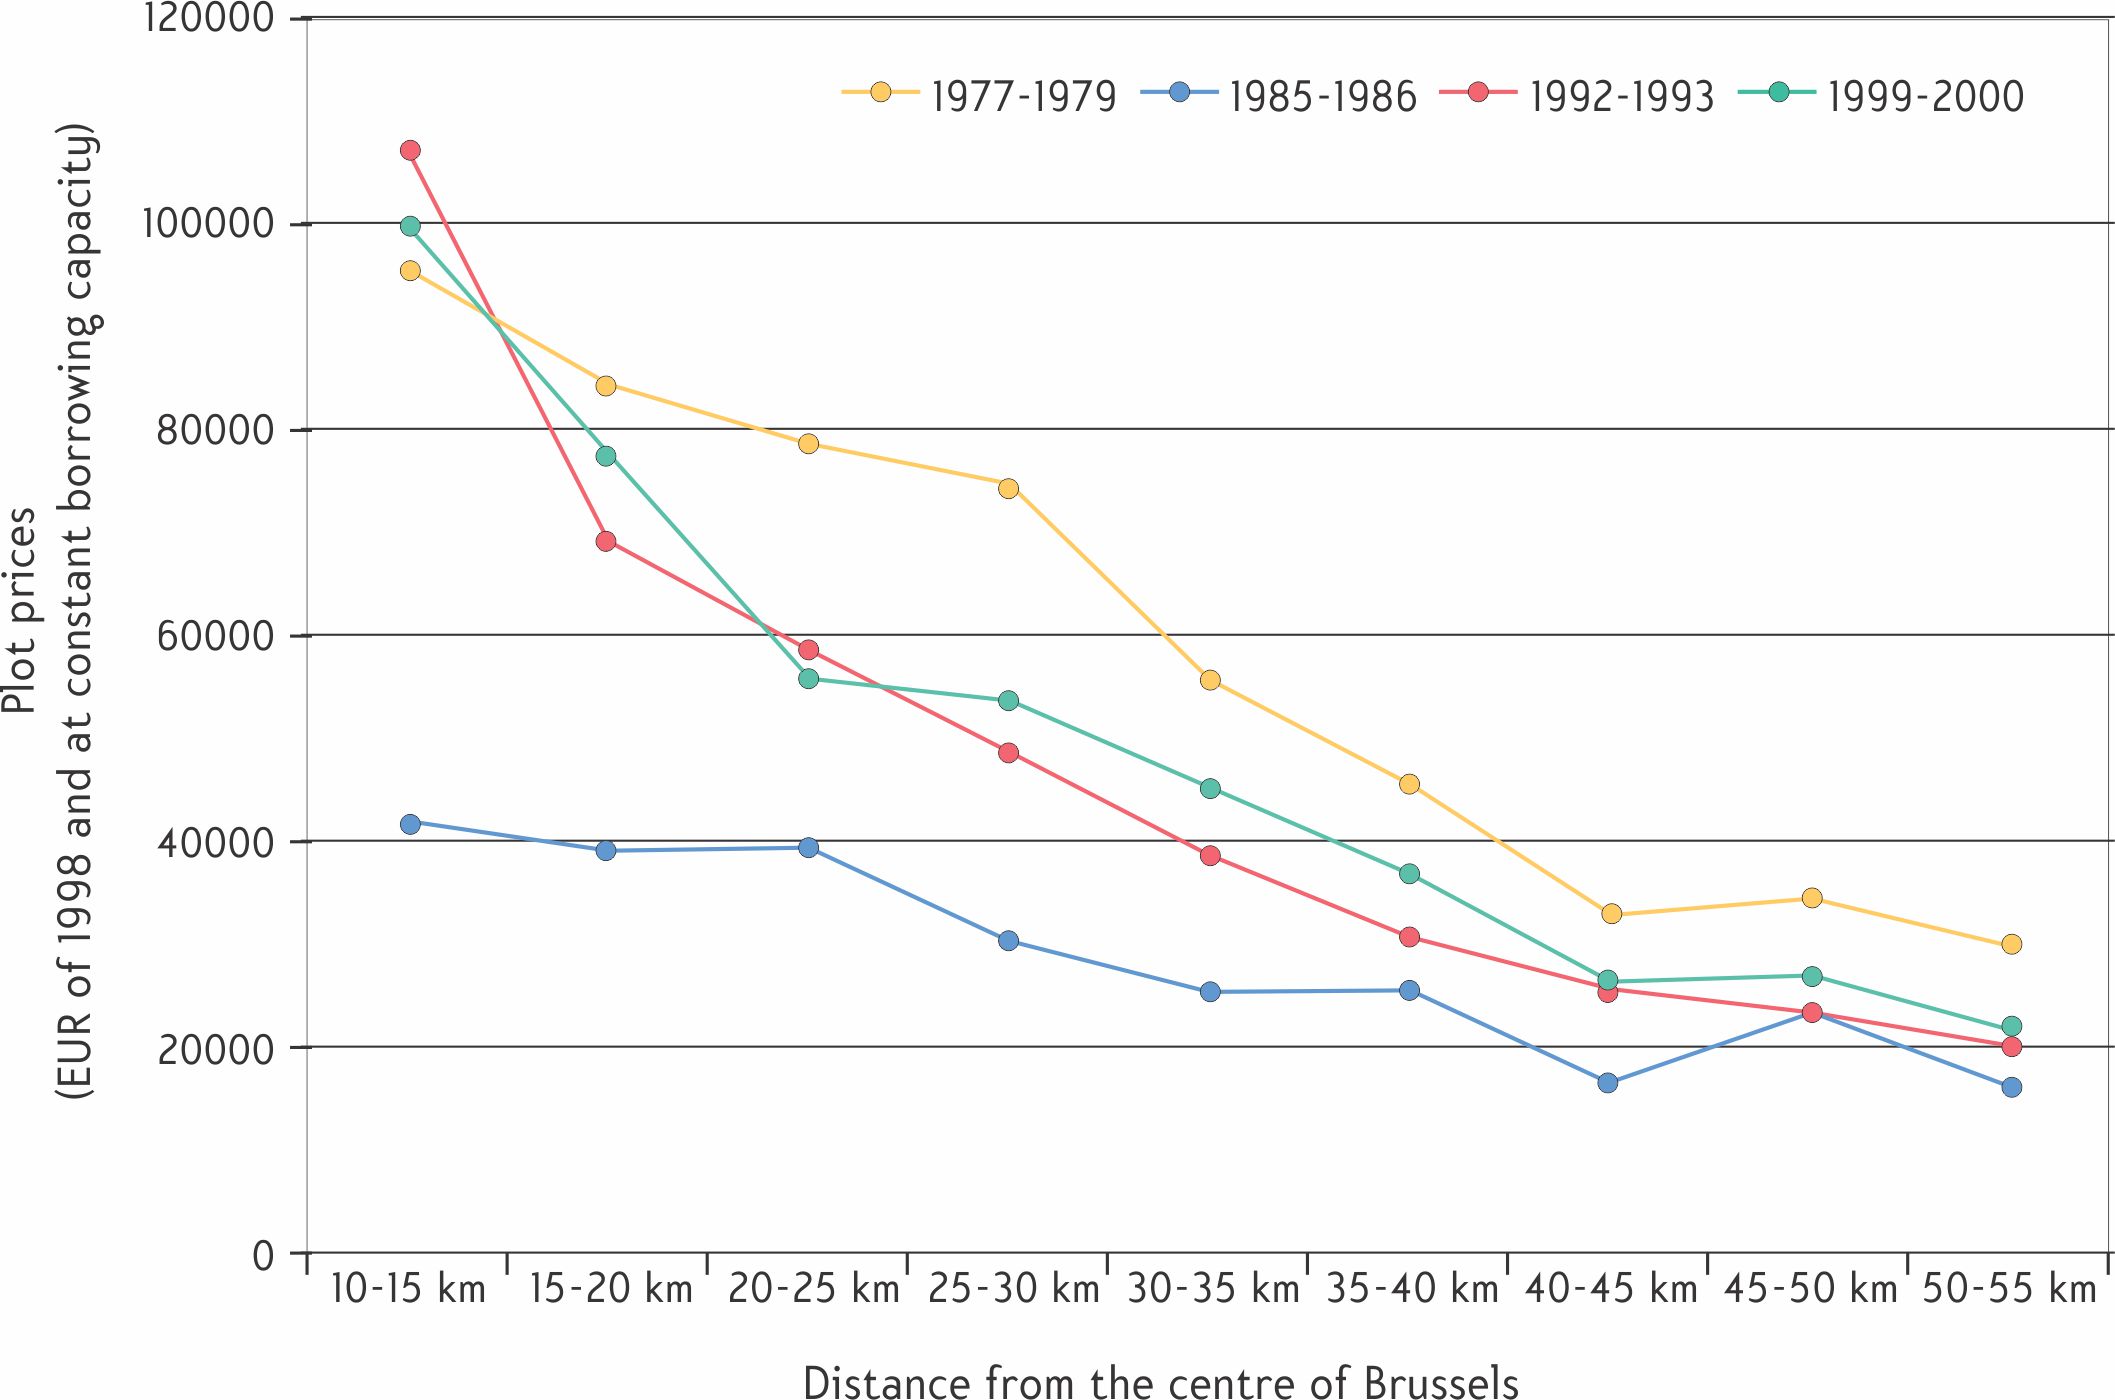
The way in which the city was built by expanding from its original centre explains the grouping of buildings according to their date of construction and their characteristics. The price of land, a product of history, contributes to reproducing and modifying the spread of people and activities in the city. As you will see in the graph below, the price of plots of land is significantly higher in the centre. This pushes the less intensive land uses to the periphery, which are usually those which cannot generate sufficient financial margin to compete for central land (or premises).
If plot prices were significantly lower in 1985-1986, this can be explained by the conjunction of a sharp increase in purchasing power, an initial decline in mortgage rates and the inertia of a depressed market in the early 1980s.
Financial effort required to acquire building plots in Brussels and its surroundings
 Source: Olivier Dubois and Jean-Marie Halleux, "Marchés immobiliers résidentiels
et étalement urbain contraint", Belgeo, 3 | 2003, available on line.
The price of the land induces the high density of occupation of the centre which results in both a high concentration of inhabitants and jobs but also in the scarcity of green spaces. This leads to the splitting up of many residential buildings in the city centre into smaller houses and, demographically, to an over-representation of single persons or small households (young adults without children, elderly people).
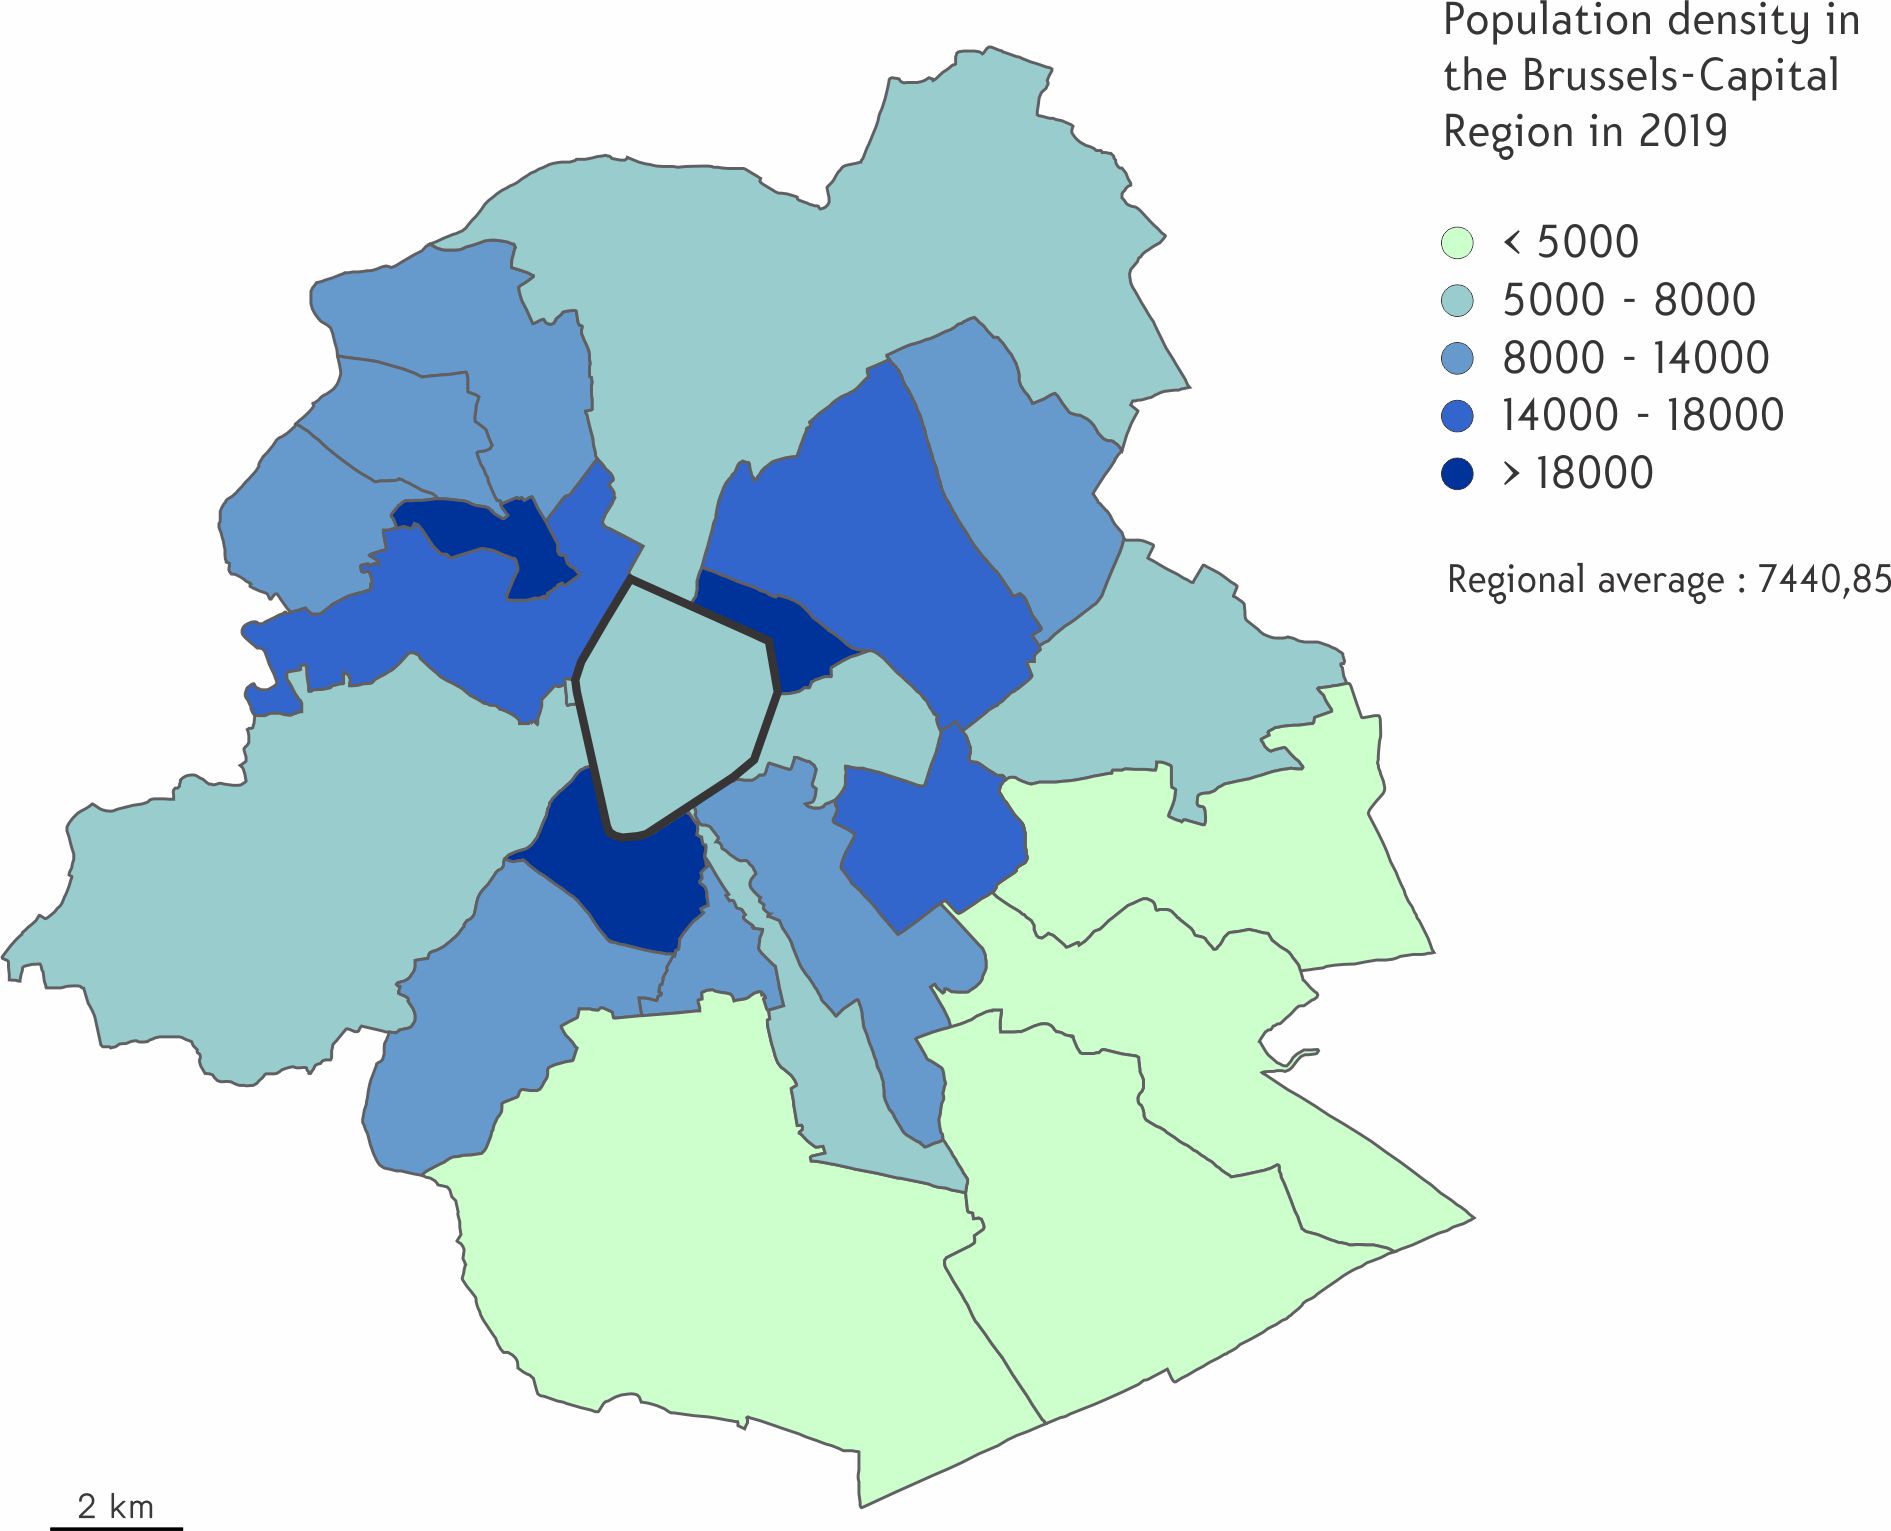
The map below also shows that in the west of the Pentagon, densities are generally higher than 14,000 inhabitants/km², while in the east, densities rarely exceed 8,000 inhabitants/km², due in particular to the presence of the Brussels' Park and the high concentration of buildings with an economic rather than a residential function.
You will also notice the difference between the high densities present within the first 'crown' and a second crown where the inhabitants are already less concentrated, particularly in the south and east side of the Region.
 Source: Monitoring des quartiers - IBSA
The geographical location of places of power and decision-making
It is in the particularly accessible central area that the political and economic leadership got established, which materialised over the last half century by the construction of numerous office buildings as you will see on the map below. You can also see that within the central city, the displacement of housing in favour of tertiary functions took place much earlier in the upper part of the city and in the east (Leopold Quarter), where the latter soon reclaimed the prestigious housing abandoned by the wealthy classes.
It is also in this central space that exceptional shops and cultural infrastructures of great influence chose to be located (see sections 4 and 6). The history of the urbanisation of the centre has finally fostered a specific heritage, part of which is now exploited for tourism.
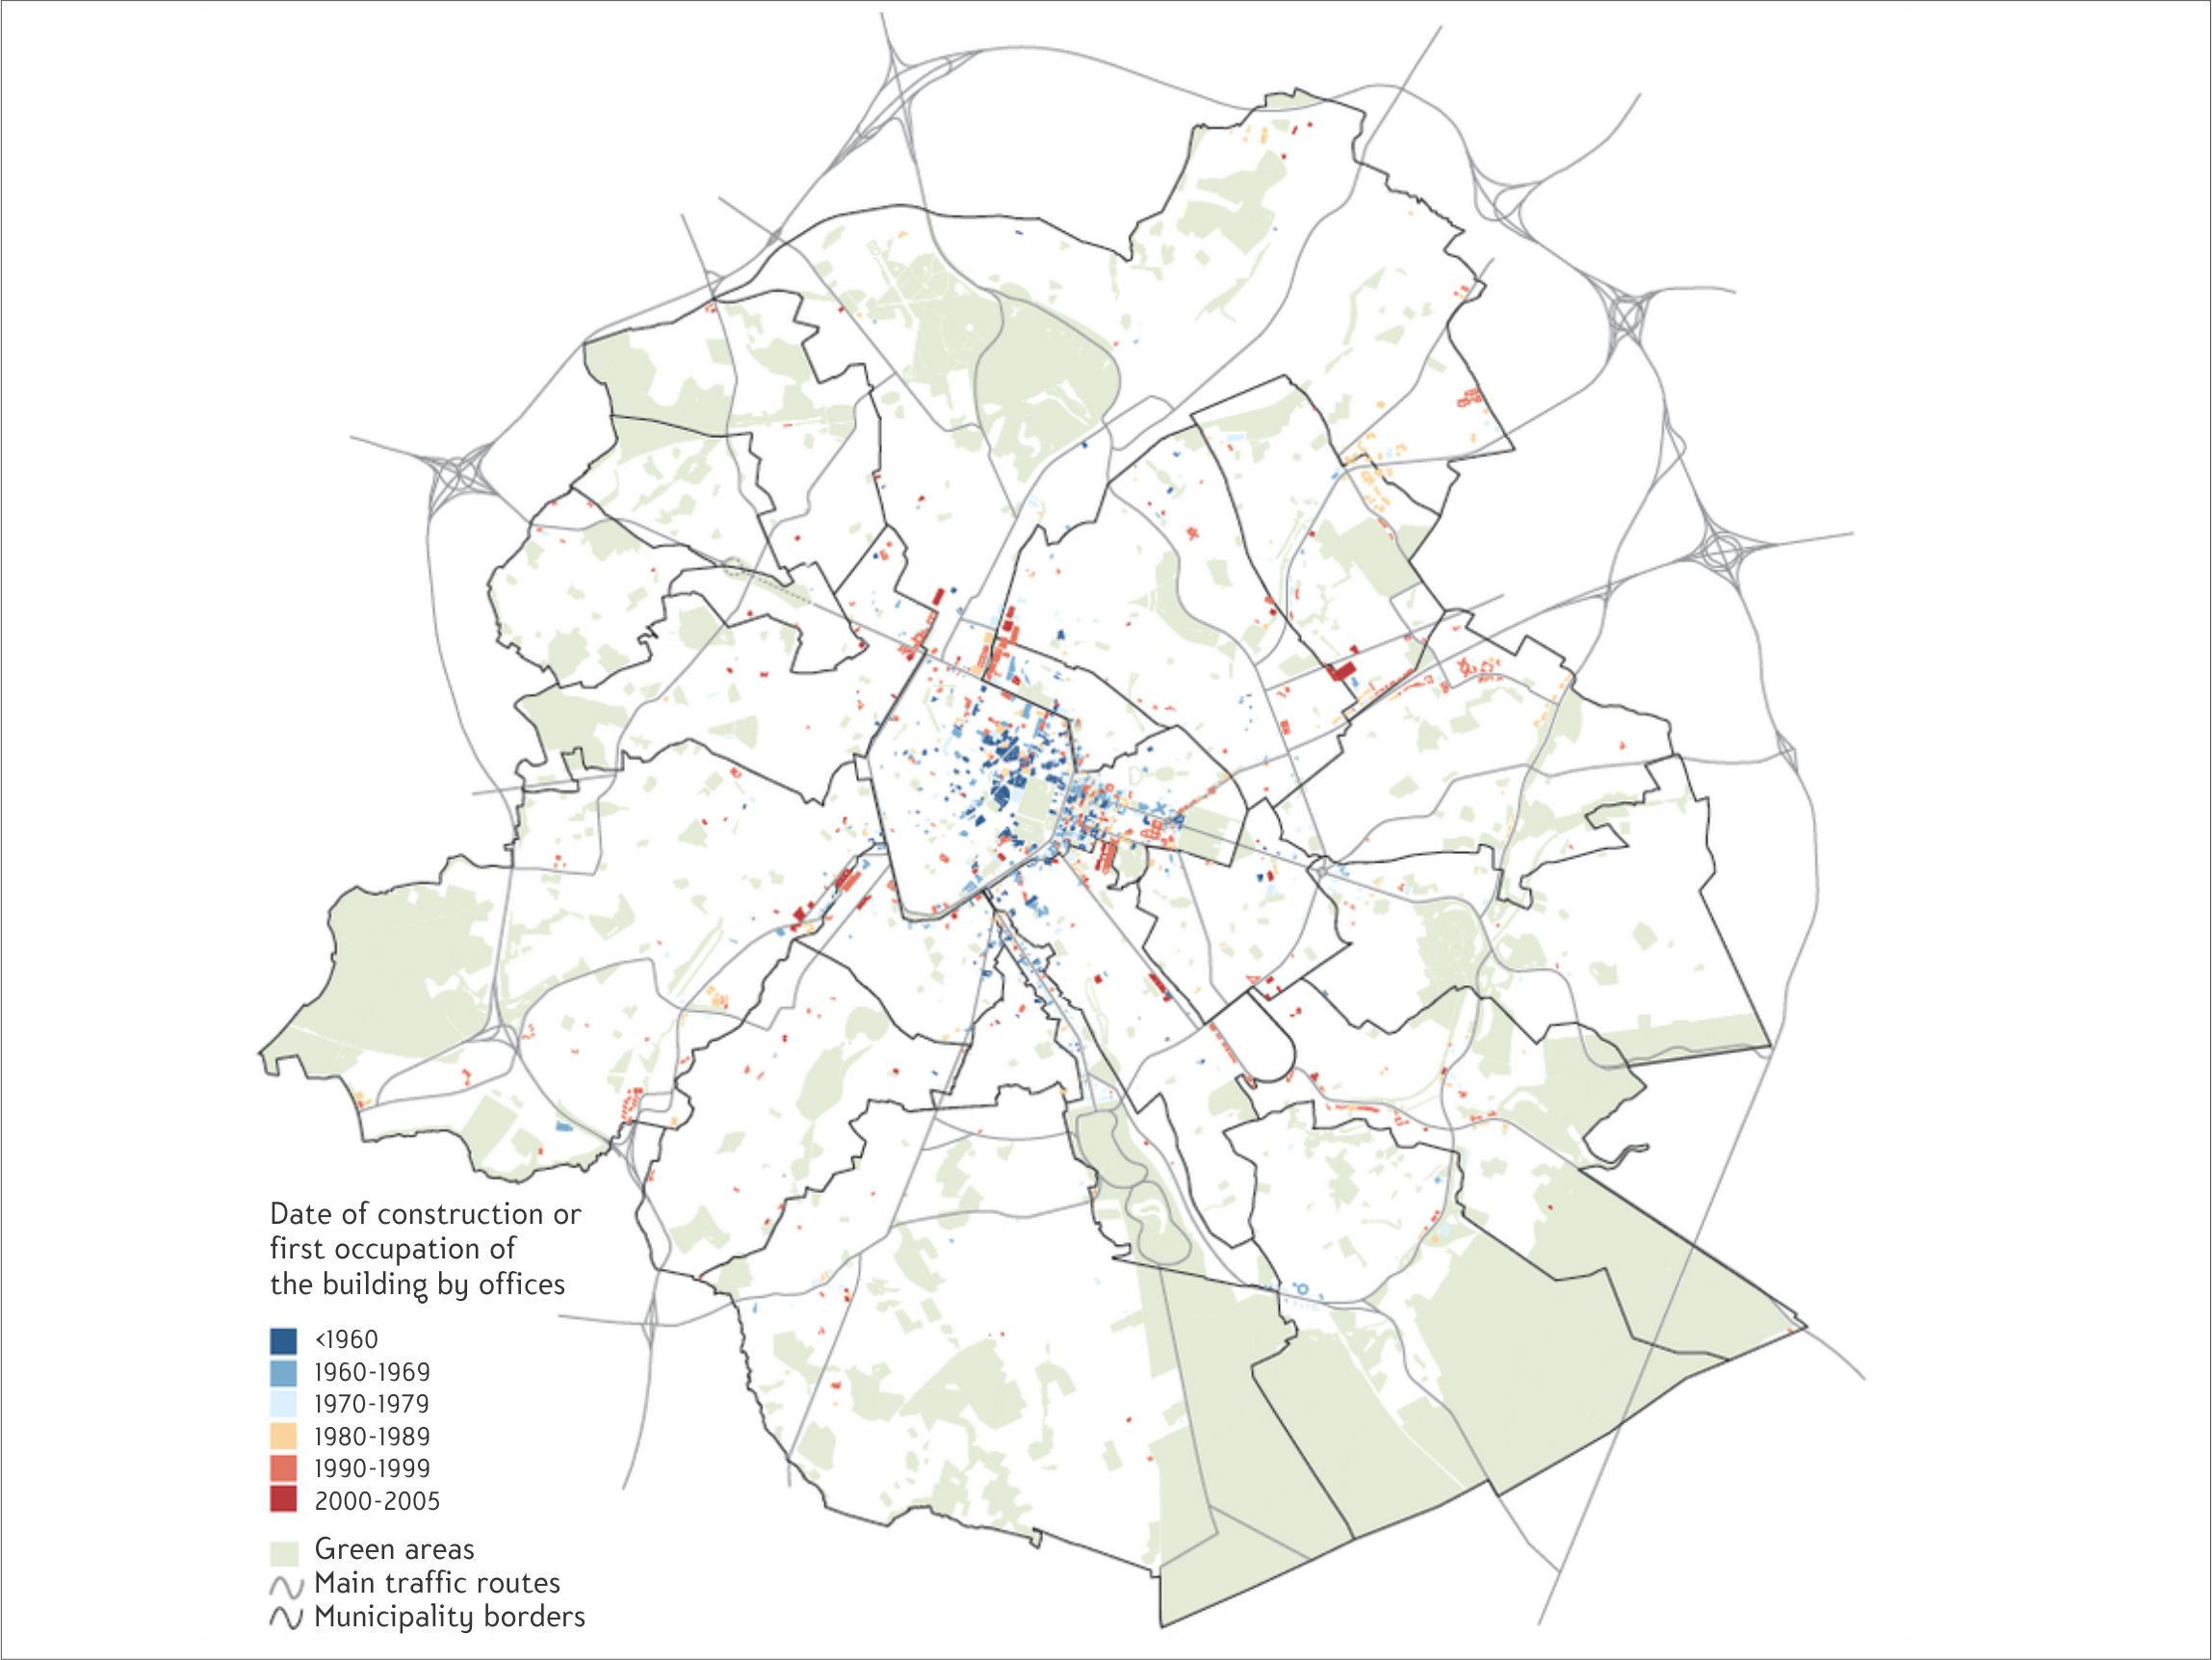 Evolution of the spatial footprint of offices.
Source: Observatoire des bureaux (Ministère de l’Aménagement du territoire et de l’urbanisme de la Région de Bruxelles-Capitale). Map included in the article of DESSOUROUX, Christian, "Fifty years of office building production in Brussels. A geographical analysis", Brussels Studies [Online], Collection générale, n° 35, 2010.
The distribution of income and social classes
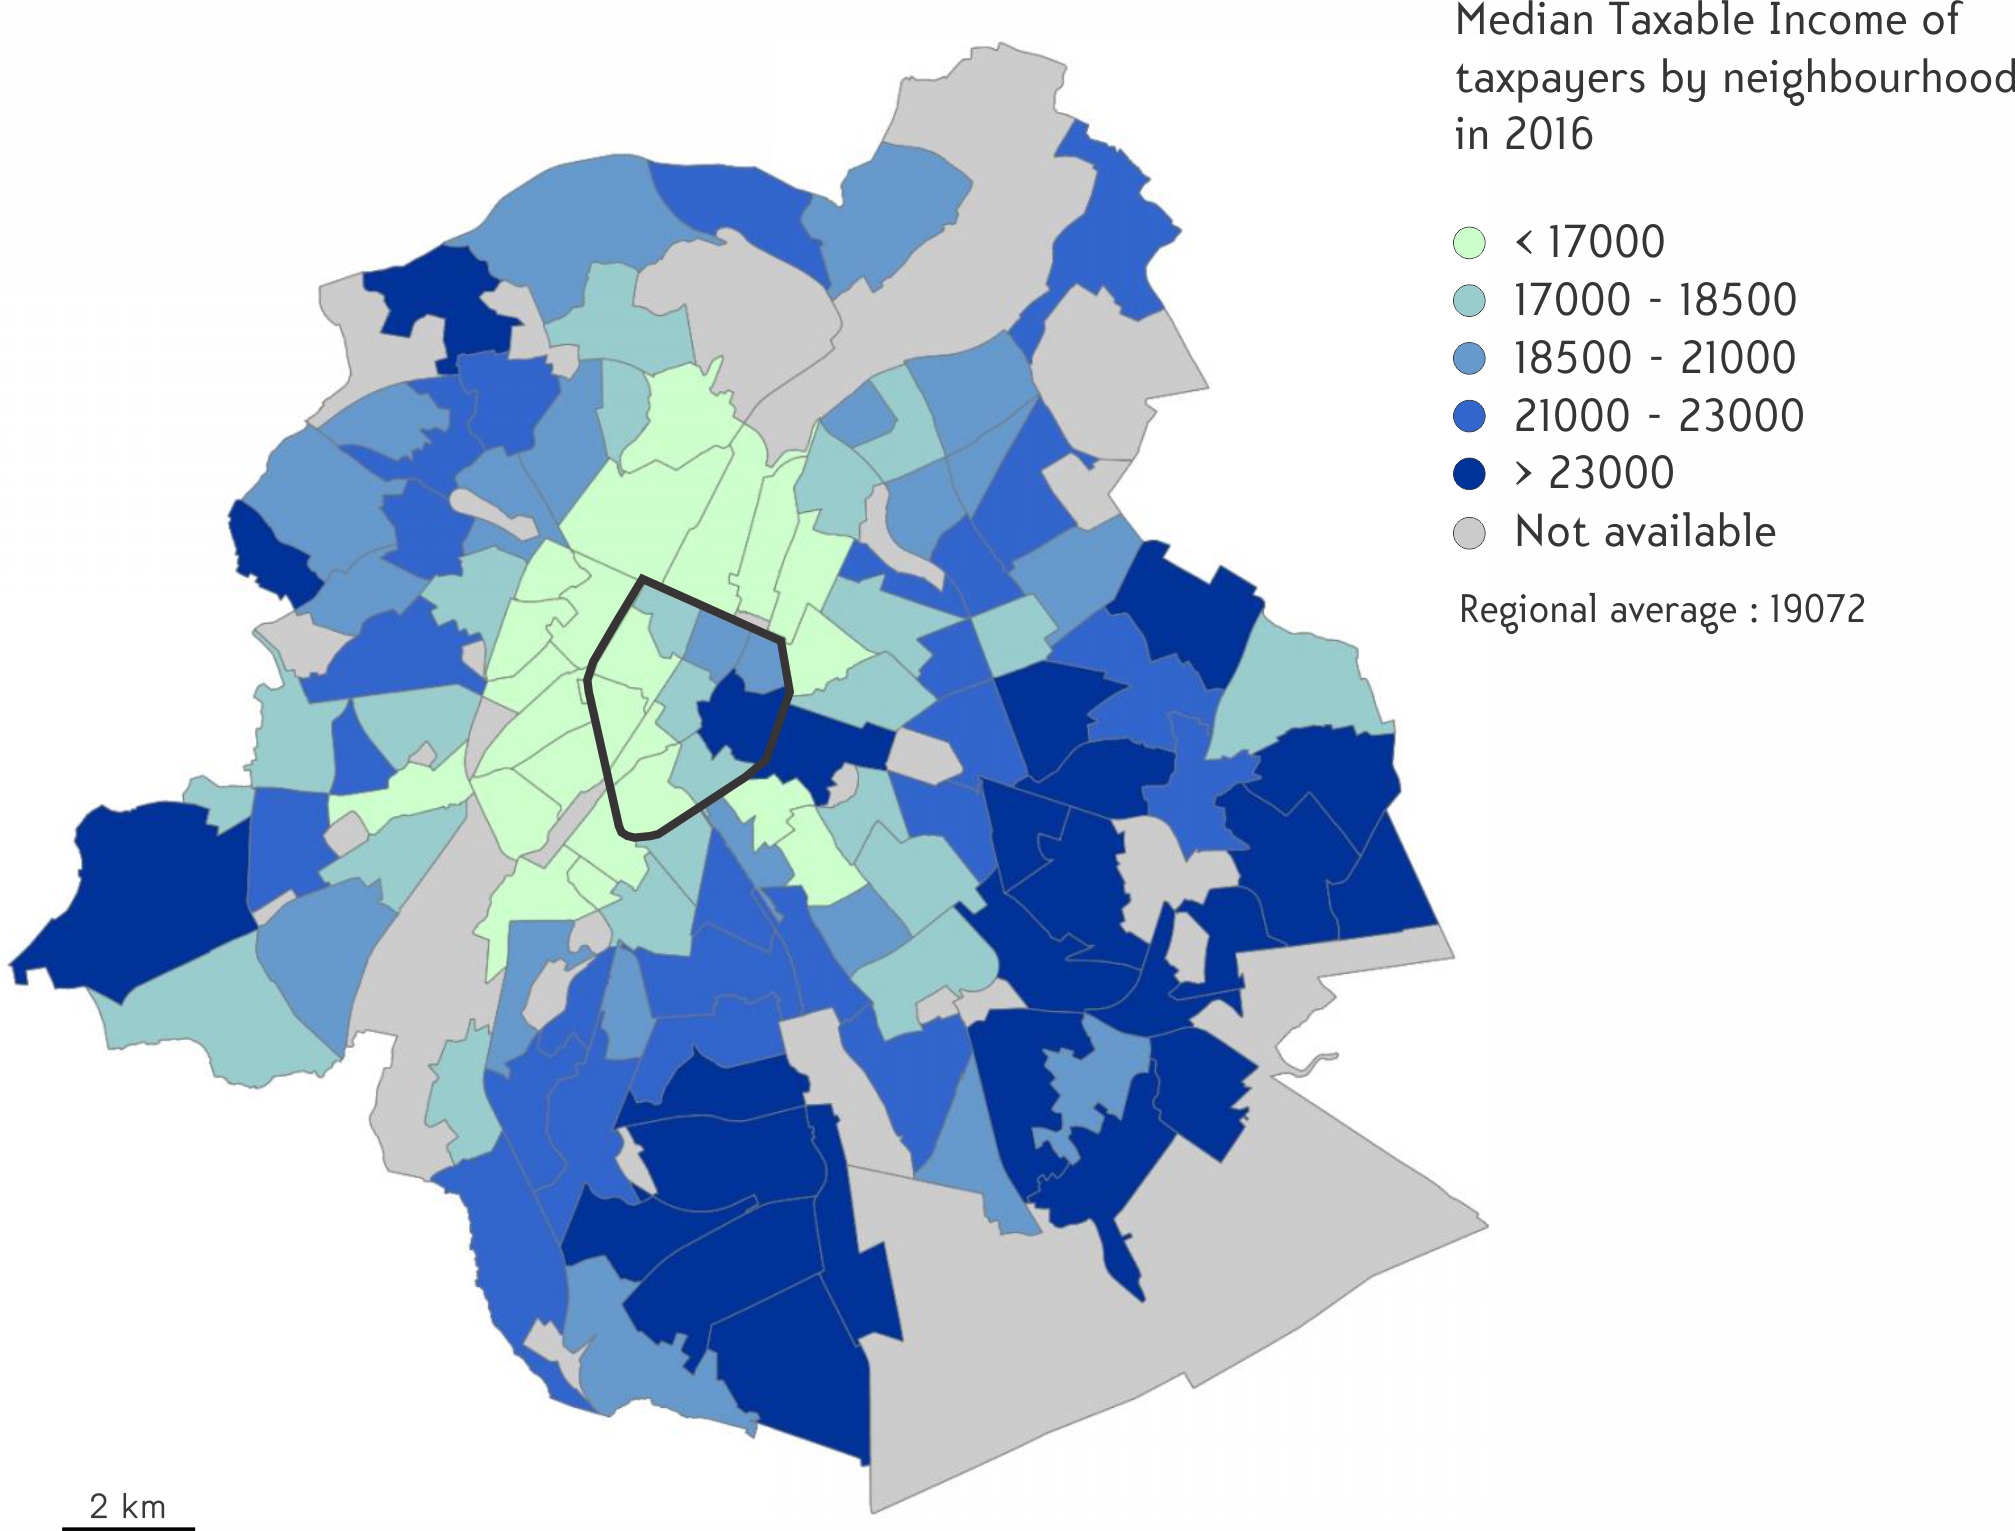
Reflecting urban growth, the distribution of population densities is mainly a reflection of the concentric structure of Brussels. However, it is also marked by the east-west social opposition, with higher densities in the west, including the second 'crown'.
The income geography you already saw earlier also makes it possible to better understand the opposition between the low levels of the former industrial axis (west of the central city) and the higher levels of the south-eastern quadrant. This opposition is found with decreasing intensity towards the periphery, where the well-off neighbourhoods tend to form a more consistent outer ring.
 Source: Monitoring des quartiers - IBSA
Housing determines the quality of life
Housing is obviously at the heart of spatial differentiation logics because it largely determines the quality of life, whether directly (on the domestic scale) or indirectly (on the scale of the neighbourhood life).
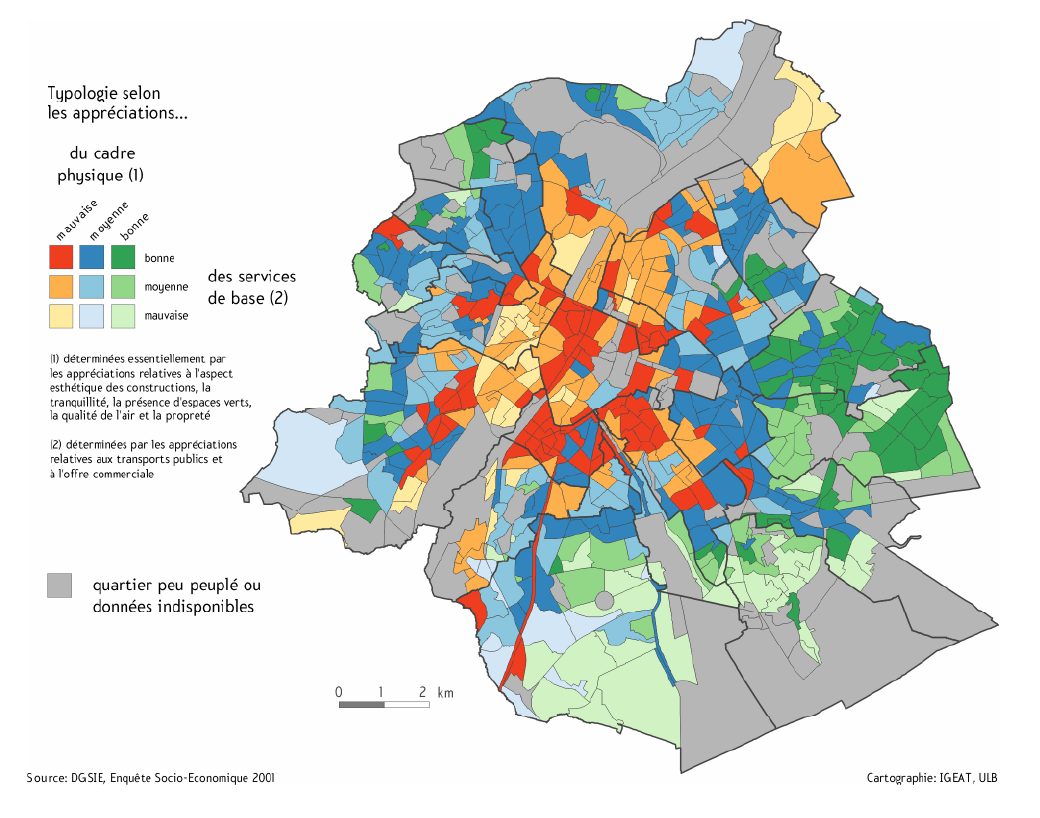
When people are asked to rate the living environment of their neighbourhood, their satisfaction largely reflects the major urban divides. The map below shows a contrast between the richer and more airy outlying districts, especially in the south-east, and the old central districts, especially those housing the poorest inhabitants. This geography has many analogies with the socio-economic structuring of the city, and this link is sustained by the functioning of the housing market (where the ability to choose one's residence, and therefore also the environment of the residence, is largely dependent on one's financial capacity). For example, with regard to public spaces, the lack of accessible green spaces within the first 'crown' is glaring, especially in the west. However, it is in this area where you can find the most children, the fewest private gardens, the most densely occupied buildings and where the environment in general is the least appreciated.
Do you have a suggestion, comment or remark about this activity? Click here!

