
Activity 9 - Brussels, a green city... but not for everyone

Brussels, Europe's greenest capital?
Activity 9 - Brussels, a green city... but not for everyone
As you have seen throughout the previous six sections of this course, Brussels developed along a west-east axis, with pronounced social differences. Wealthy populations settled on the eastern slopes of the Senne, on higher ground, to benefit from a more favourable environment, while the proto-industries and poor populations settled to the west of Brussels, on the flood plain of the Senne. You have also seen throughout this section that it is in the south-east of Brussels that you will find the most green spaces, the most cool islands, the most private gardens, and so on. It is also in these neighbourhoods that the most affluent people live.
More and more people around the world are coming to the conclusion that environmental issues are directly linked to social inequalities. This is also true in Brussels, where we call it environmental inequality.
Listen carefully to this video by Catherine Bouland, Professor at ULB and interviewed for the journal Medor, before reading on:
Environmental inequalities can be classified into four different types:
- The quality of the immediate environment
- The ecological footprint
- The impact of environmental policies
- Capability
1. The quality of the immediate environment
Environmental quality is not the same for everyone in Brussels, and will depend mainly on the neighbourhood in which we live (what materials are used in our homes, on our roads, are there green spaces or waterways) as well as the environmental risks in that neighbourhood (risk of flooding, soil pollution, air pollution, etc.).
The central districts of Brussels and the 'poor crescent' are the areas of the city with the least access to green spaces, as you saw at the beginning of this section. This reduces their access to a quality environment. You have to move away from the city centre to find more green spaces, more spacious houses, less dense neighbourhoods and households with higher incomes (remember what you saw in activity 8 of Section 2). We can see that the denser the neighbourhoods and the lower the incomes, the greater the environmental risks.
Remember these maps that you've already seen. We're putting them back here because they represent three environmental risks: heat islands, noise exposure and the risk of flooding. The densest and poorest central districts of Brussels are also those most exposed to environmental risks.
Conversely, neighbourhoods in the south-east of Brussels with a higher socio-economic profile have more green spaces (first map) and lower levels of PM2.5 fine particles (second map).
Let's take one last example. Look at this map showing air traffic noise in Brussels in 2020.
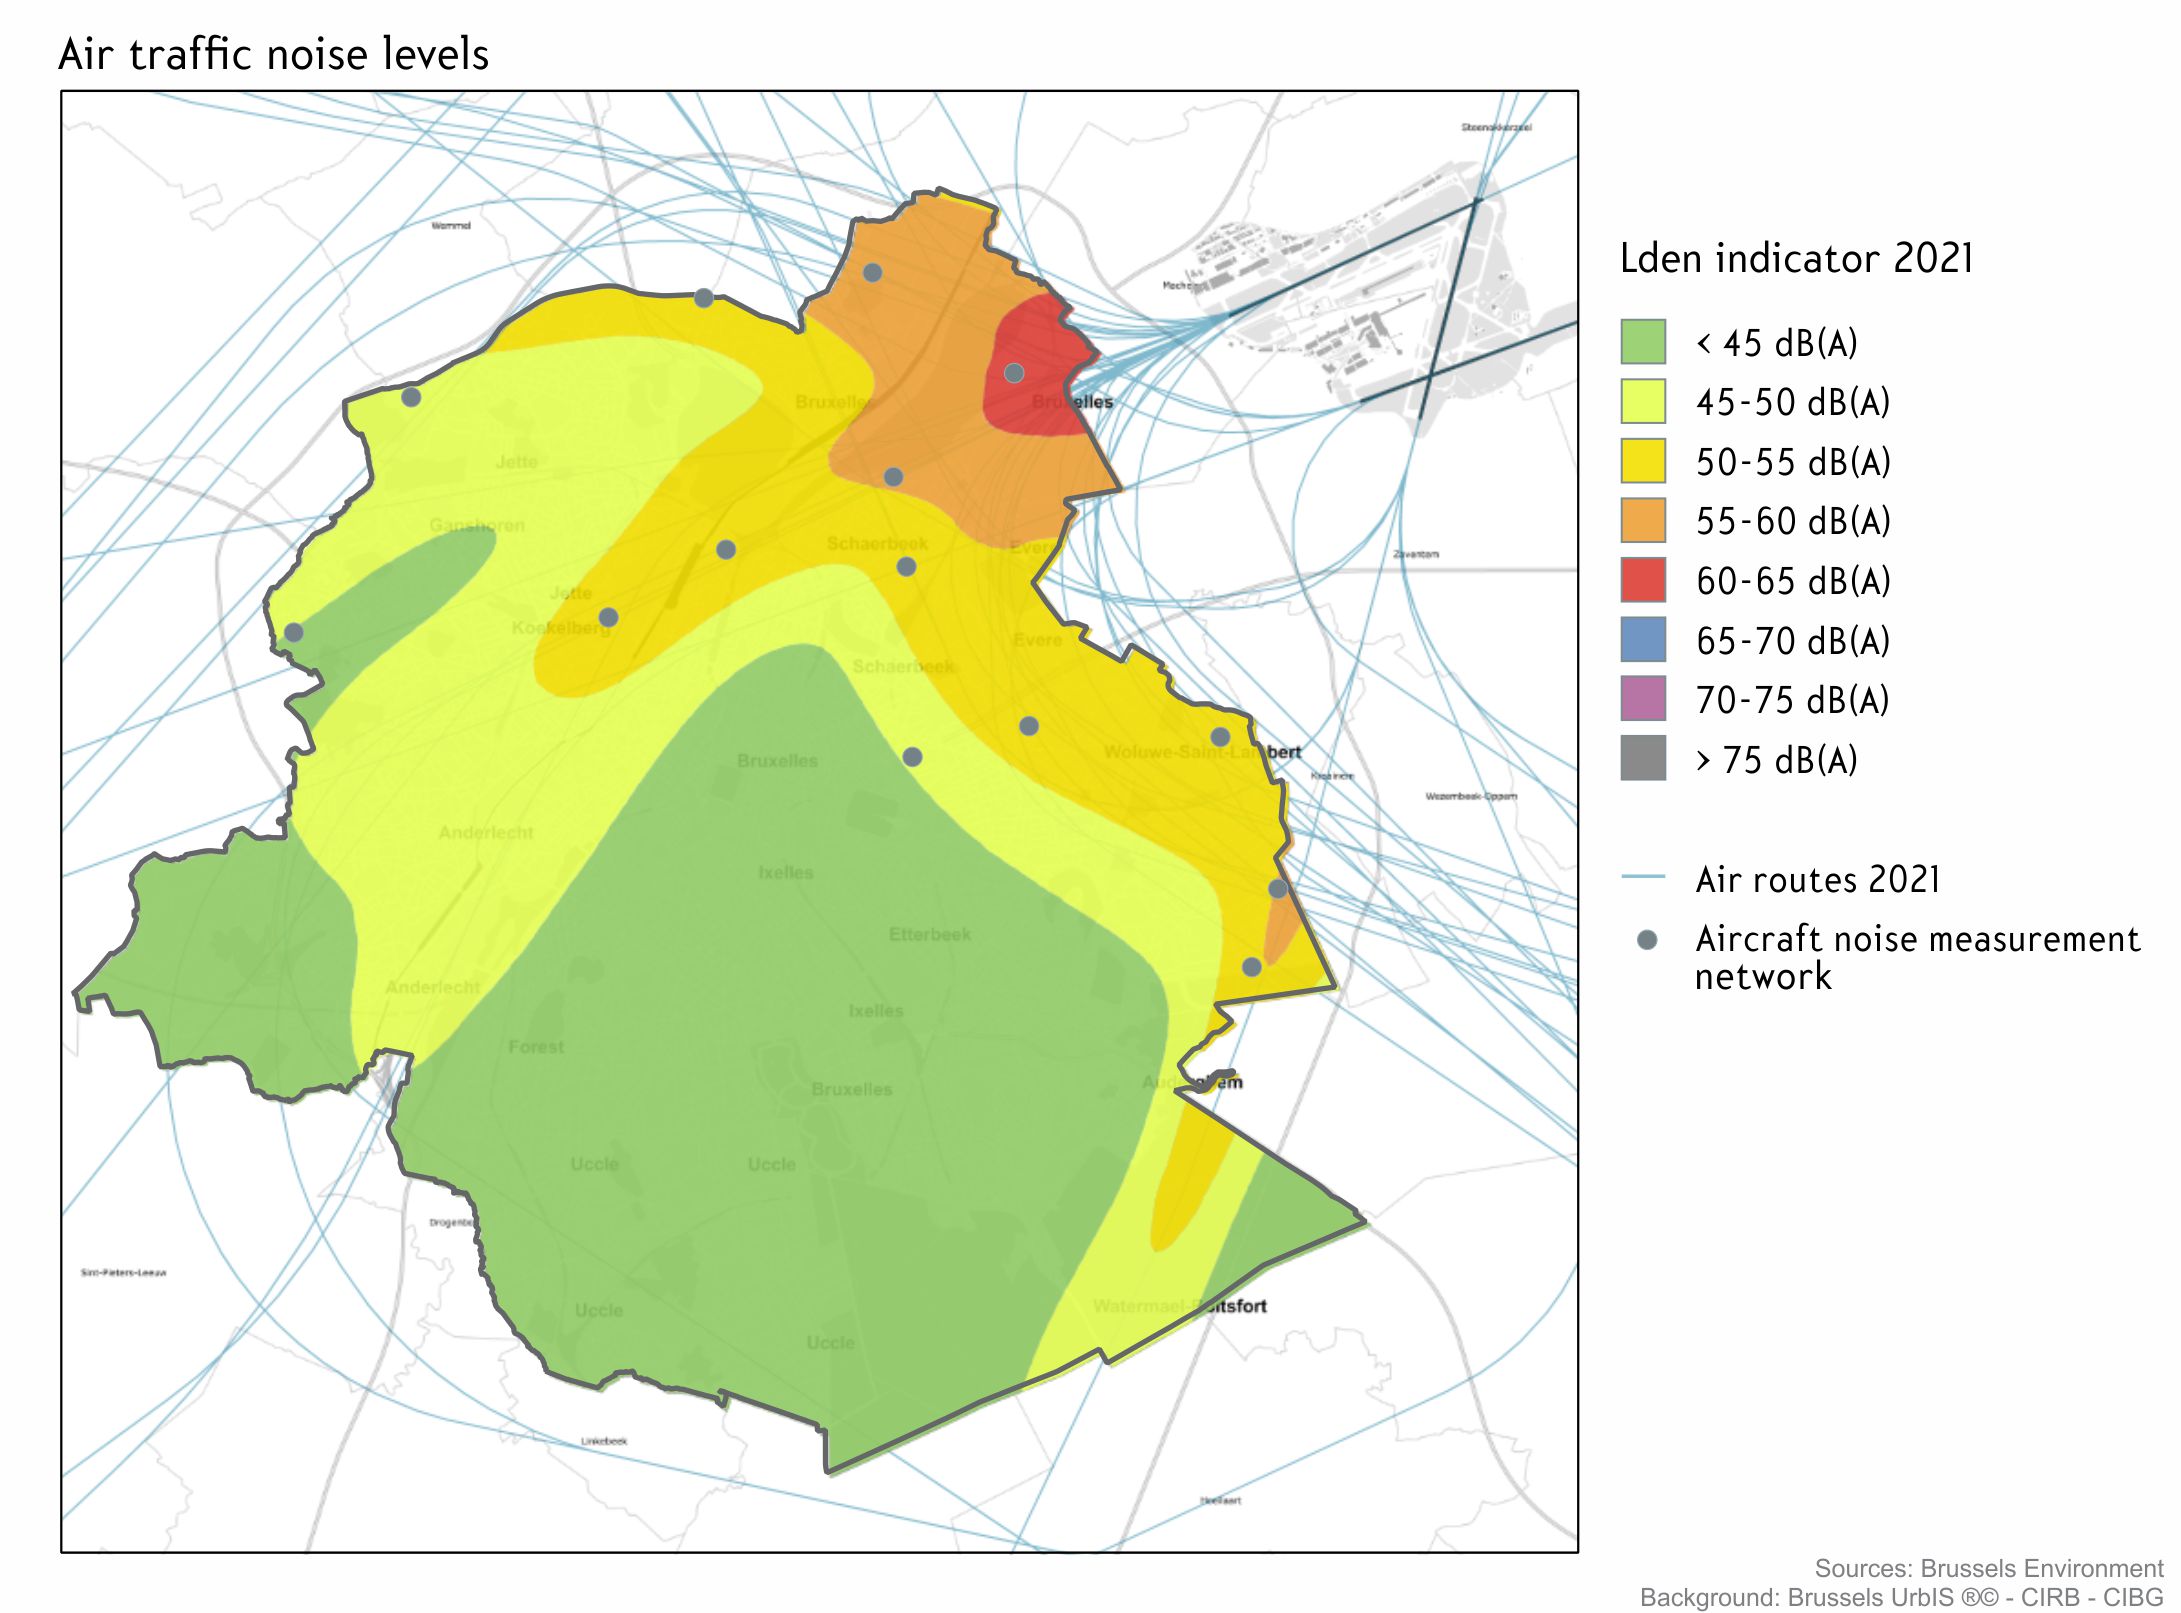
Air traffic noise register in 2020 - Lden indicator. Source: Bruxelles Environnement, 2021, "Cartographie du bruit du trafic aérien en Région de Bruxelles-Capitale - année 2020", based on 2020 traffic data, ECAC-1997 method, CadnaA modelling software. Note: Only the air routes used for modelling are shown. Noise: the state of the art | Citizen - Brussels Environment (Remember that the World Health Organisation recommends not exceeding the threshold of 55 decibels during the day and 45 decibels at night).
As you can see, it is mainly the districts to the north of Brussels that are affected by air traffic noise, as these are the districts closest to the airport. But the various air routes that fly over Brussels also have an impact on other neighbourhoods. Take a look at this map showing the main air routes over Brussels.
While the "Ring" and "Lima" roads bypass Brussels, the Canal route passes over the city's most densely populated areas, which are also the poorest neighbourhoods. The areas in red correspond to the districts where unemployment is particularly high in Brussels. And as you can see, these are once again the city's former industrial districts, located to the west of the centre. In short, the poorest neighbourhoods, which are particularly densely populated and have higher unemployment rates, are the worst affected by the noise pollution caused by aircraft overflights.
The quality of the environment in Brussels is therefore very uneven between different neighbourhoods with different socio-economic levels. This has a major impact on the health of residents, who are more exposed to a range of illnesses: cardiovascular accidents, respiratory diseases, allergies, cancers, endocrine system disorders, neurodevelopmental diseases, etc. in both the short and long term. In Belgium, the World Health Organisation estimates that in 2012, 13,000 people died as a result of a degraded environment! To discover the impact of pollution in Brussels on the health of its inhabitants, we strongly recommend that you take a look at "Brussels ill", an interactive article published by the independent newspaper Medor in 2022.
2. The ecological footprint
A second environmental inequality after environmental quality concerns the ecological footprint. You've probably already heard of it; it's a measure that seeks to quantify the surface area (land and sea) required to produce the resources for a given lifestyle, taking into account different parameters. A person living in Brussels does not have the same ecological footprint as someone living in the Moroccan or Colombian countryside, for example, just as a vegetarian has a much smaller environmental impact than someone who eats red meat every day. There are various methods of calculating the ecological footprint, but they are often incomplete, as they generally do not take into account the pollution emitted in the countries where our clothes or cars are made, or the waste generated. But you can start by taking this test, which will give you an initial estimate of your ecological footprint: https://www.footprintcalculator.org/home/en
The main conclusion of these surveys is that the biggest consumers are the biggest polluters (whether in developed countries or among the more affluent). This difference is explained in particular by the Land Take, i.e. the floor space required for our homes. The Land Take of a villa occupied by two people and surrounded by a garden is much greater than that of a family living in a flat. What's more, 84% of people living in a single-family home have a car, compared with 47% of people living in a flat in Brussels. Living in a villa and having a car are generally associated with higher incomes and the presence of children in the household. Finally, people on higher incomes are more likely to travel by air. In 2014, 50% of people with a higher education qualification said they had flown in the last twelve months, compared with 10.5% of people with a secondary school qualification (usually obtained by the age of 18). You'll also remember that Brussels is home to many European and international institutions, which inevitably leads to a lot of international travel, most of which is by plane.
Curiously, the opportunity to reduce one's carbon footprint is often seen as a privilege reserved for wealthier people who have the means to spend more on environmentally-friendly alternatives (such as an electric car rather than a petrol-powered one, organic rather than conventional food, etc.). This perception leads to a certain stigmatisation of people who do not follow these trends, whether out of financial constraint or choice.
3. The impact of environmental policies
Many environmental policies have been implemented in Brussels, such as the Low Emission Zone, which bans the most polluting cars from the city, as well as subsidies for home insulation, environmental taxation and eco-cheques to encourage the purchase of environmentally-friendly products. However, all these measures have a different impact depending on people's income and resources. Let's take three examples: public policies on mobility, housing and support for citizens' initiatives to make their environment greener.
Public policies on mobility aimed at reducing the environmental impact of travel include measures to support public transport, but also restrictions on the most polluting vehicles through the introduction of the Low Emission Zone (LEZ). These strict criteria in Brussels have a more severe impact on low-income households, for whom the purchase of a recent vehicle that meets the required standards is not a matter of course. Another aspect concerns incentives to give up one's car, as demonstrated by the Bruxell'Air programme. This initiative offers financial incentives for the use of public transport and cycling. However, you have to get rid of your car to benefit from this incentive. As a result, households in Brussels that cannot afford to own a car will not be able to benefit from this aid to use alternatives, even though they have lower incomes.
As far as housing is concerned, the majority of public funds allocated to housing in Brussels go towards the acquisition and renovation of housing (60%), rather than investment in rental properties (40%). Homeowners are therefore the first to benefit from this public aid. Yet in the central municipalities of Brussels, 60-75% of residents are tenants.
If you want to know more about support policies and the link with environmental inequalities,
take a look at Alice Romainville's article published in the electronic journal
Brussels Studies. : ROMAINVILLE, Alice, 2010. Who benefits from home ownership support
policies in Brussels? Brussels Studies [online]. 25 january 2010.
http://journals.openedition.org/brussels/742
This inequality can also be seen in other areas, such as calls for citizen projects aimed at greening public spaces (Quartiers Durables Citoyens, Inspirons le Quartier...) or the creation of neighbourhood composts, projects in which the most disadvantaged populations are generally little included.
Generally speaking, it is easy to imagine that the most disadvantaged people, who do not always have access to the information they need to apply, who work unconventional hours, or who do not have a sufficient command of the official languages, find it more difficult to benefit from grants or to take part in calls for projects to improve their neighbourhood. This brings us to the final aspect of environmental inequalities: the ability to act.
4. Capability
The fourth and final type of environmental inequality concerns capacity to act. The Indian economist and philosopher Amartya Sen has defined the notion of "capability": inequalities between individuals should be assessed not only in terms of their resources (their income, for example), but also in terms of their freedom to act, their possibilities to change their conditions. These capabilities can be linked to the level of education, the right to vote, individual freedoms, civic rights, etc.
When applied to environmental injustices in Brussels, these capabilities can relate, for example, to the ability to apply for renovation or energy grants, to allocate time to compiling this type of dossier, to the ability to call political players to account in the event of inconsistencies, to the ability to take legal action against one's landlord in the event of a dispute, to access to information (and therefore a command of French or Dutch), etc. The various social groups are confronted with different environmental risks in different ways, and their ability to act and react to these risks also varies.
This means that even when housing policies target the most disadvantaged neighbourhoods, the people who benefit from them are generally not the poorest. As a result, these subsidies do not reduce environmental inequalities, but rather exacerbate them by protecting more affluent populations against environmental risks, while the most precarious people and tenants do not have access to them.
Let's take one last example and look at the noise caused by overflights of Brussels. Complaints about overflight noise (the red balls) come mainly from the east and even south-east of Brussels (the areas with the highest incomes), whereas the areas most affected by noise pollution (the green and blue areas) tend to be located in the north of Brussels, as shown on the map below. In addition, people living to the west of Brussels complain less about noise pollution from flying over Brussels, even though the Canal route passes right over their homes. More deprived neighbourhoods may also have similar concerns, but their voices are harder to make heard.
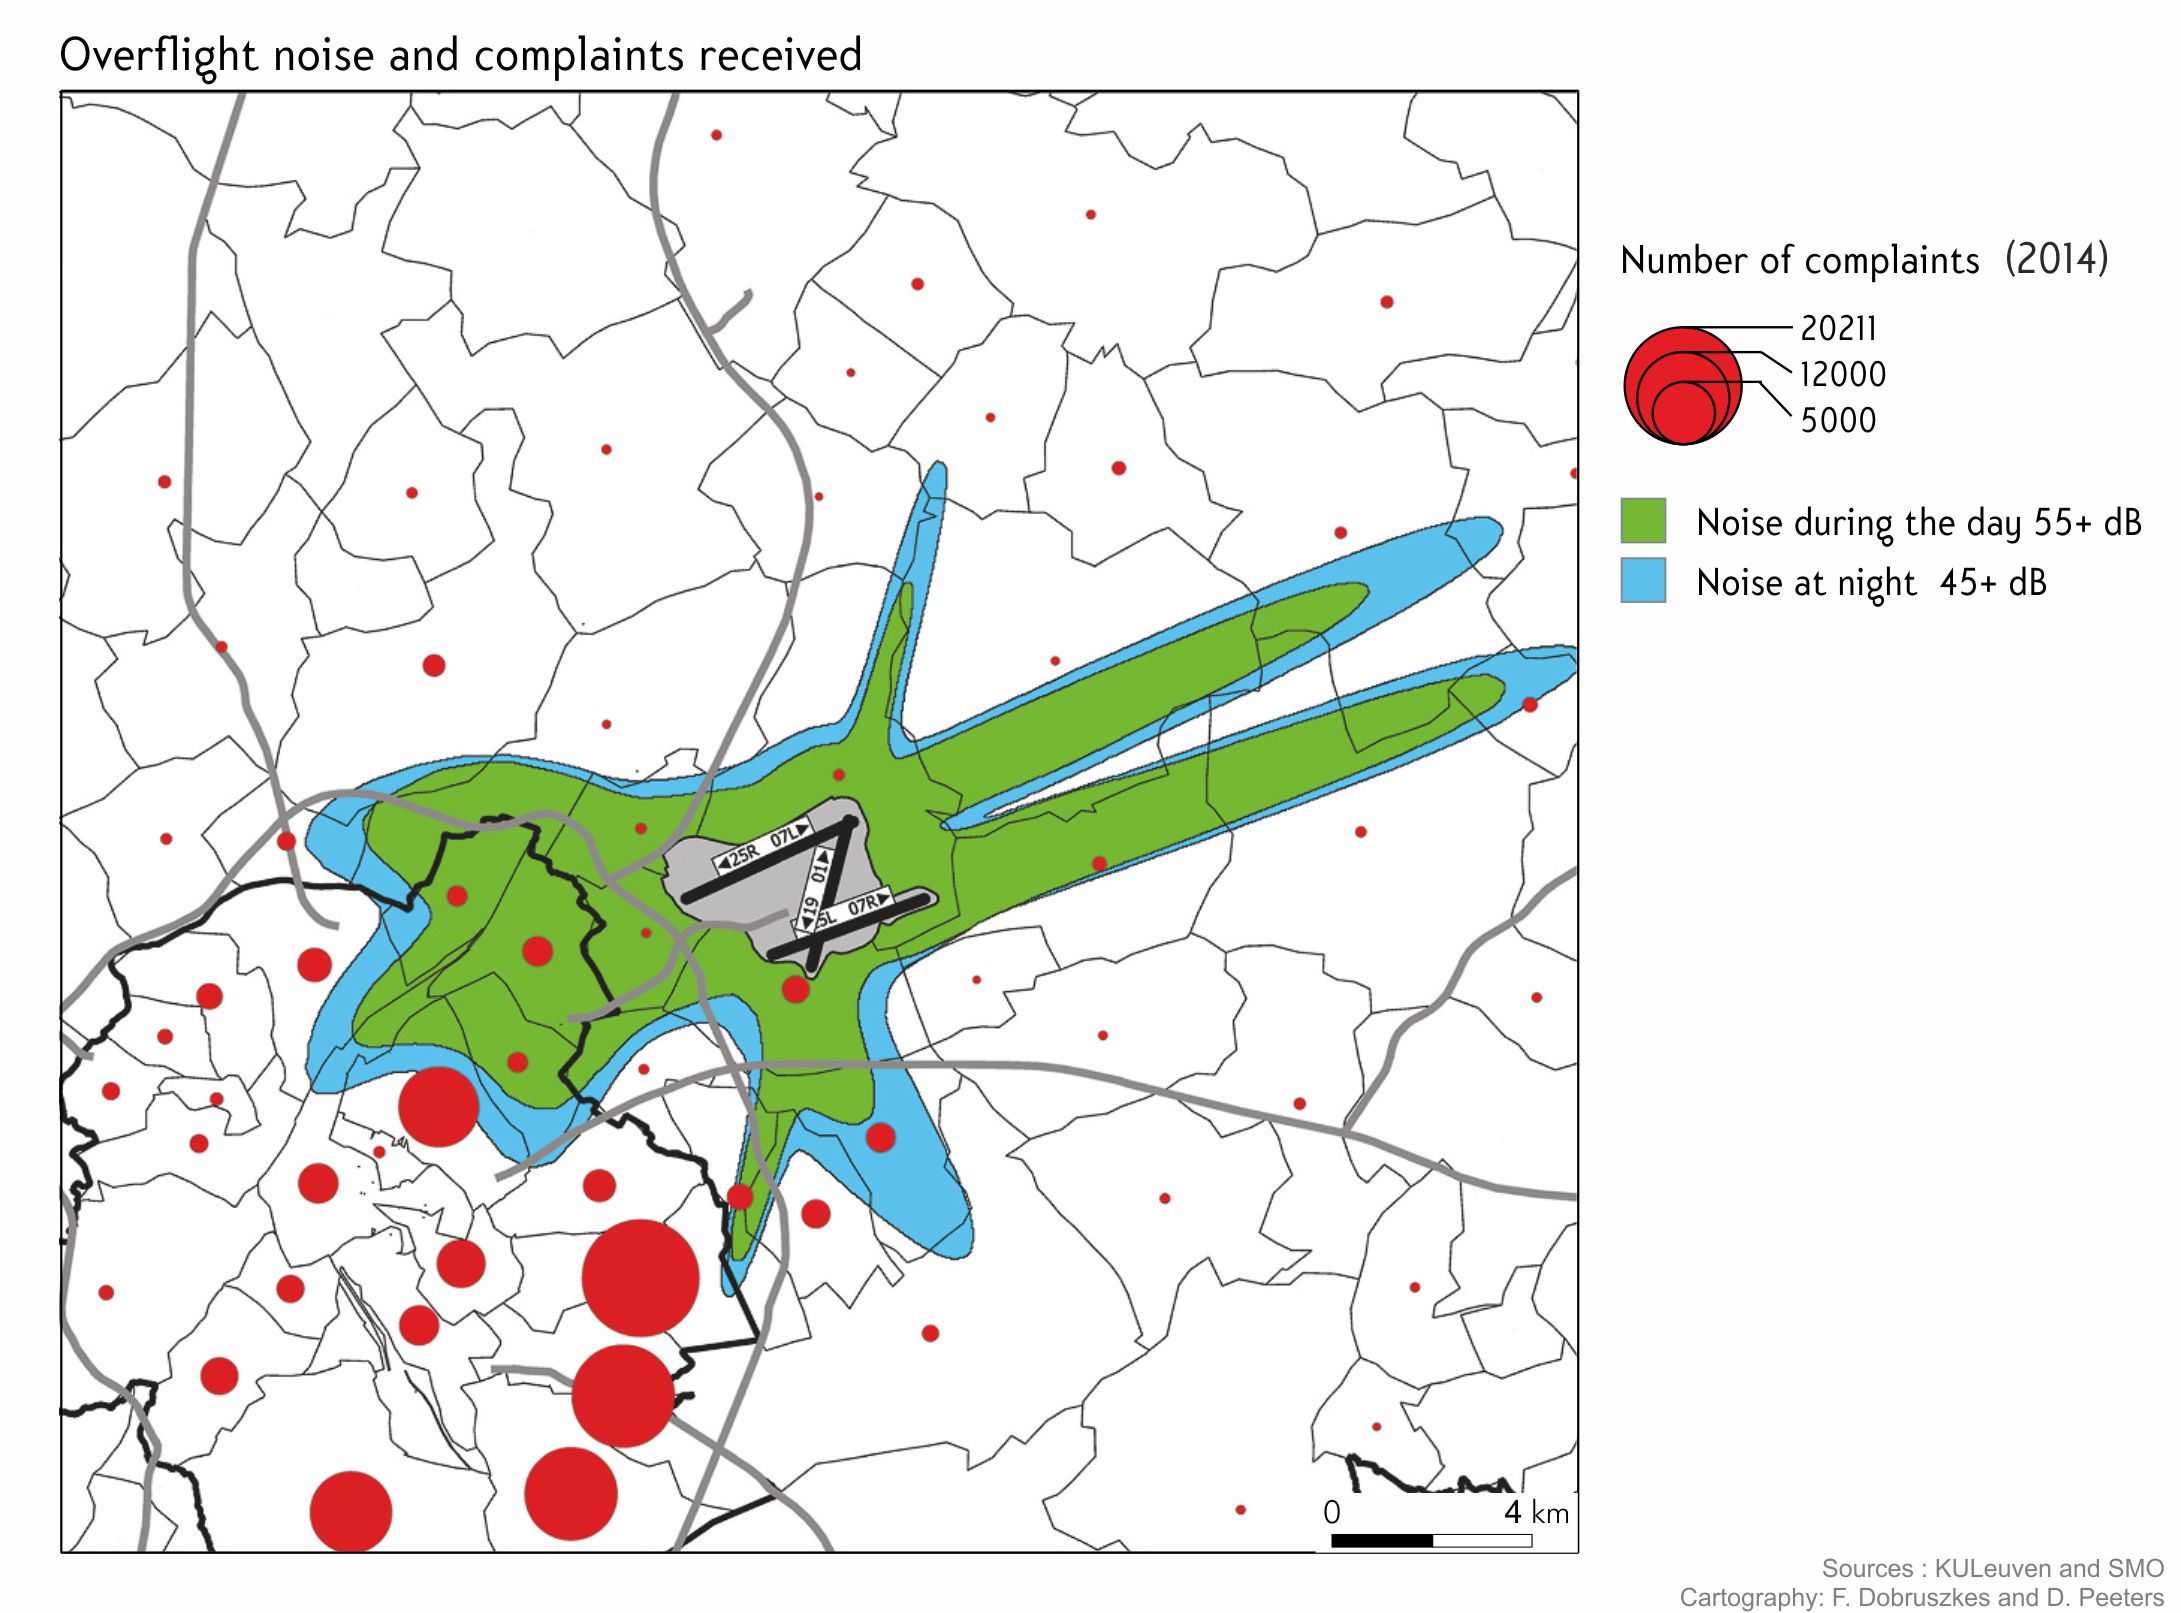
Overflight noise and complaints received (2018). In green you see the noise generated by overflights during the day, in blue the noise generated by overflights at night and in red the number of complaints per neighbourhood concerning overflight noise. (source: DOBRUSZKES, Frédéric, 2018. Survol de Bruxelles : la désinformation à l'épreuve des faits, ARAU, online)
This is because more affluent neighbourhoods have more defence and complaints committees, as their population has better access to information. Overflights of Brussels, for example, were the subject of very strong protests when a Brussels minister, Melchior Wathelet, introduced a new overflight plan in 2014. Below you can see some of the posters and materials used during the campaign:
The "Wathelet plan" (in reality, it was the Brussels government's plan, but it was to be implemented by Melchior Wathelet) was finally abandoned after many months of tension.
However, there is a higher proportion of older and less well insulated housing, including acoustic insulation, in working-class neighbourhoods. Given that the proportion of tenants is higher, incomes lower and access to information on renovation aid more difficult due to language barriers and complex procedures, the prospects for improving quality of life (such as installing double glazing or roof insulation) are also more limited.
In this chapter, we have seen that people's ability to act on their environment and their power of expression vary according to social group. It is therefore essential to work on the inclusion of all social groups in participation in order to develop fairer public policies.
Do you have a suggestion, comment, remark about this activity? Click here!

