Activity 2: Brussels at the heart of a European megalopolis

Bruxelles, the city of traffic jams?
Activity 2: Brussels at the heart of a European megalopolis
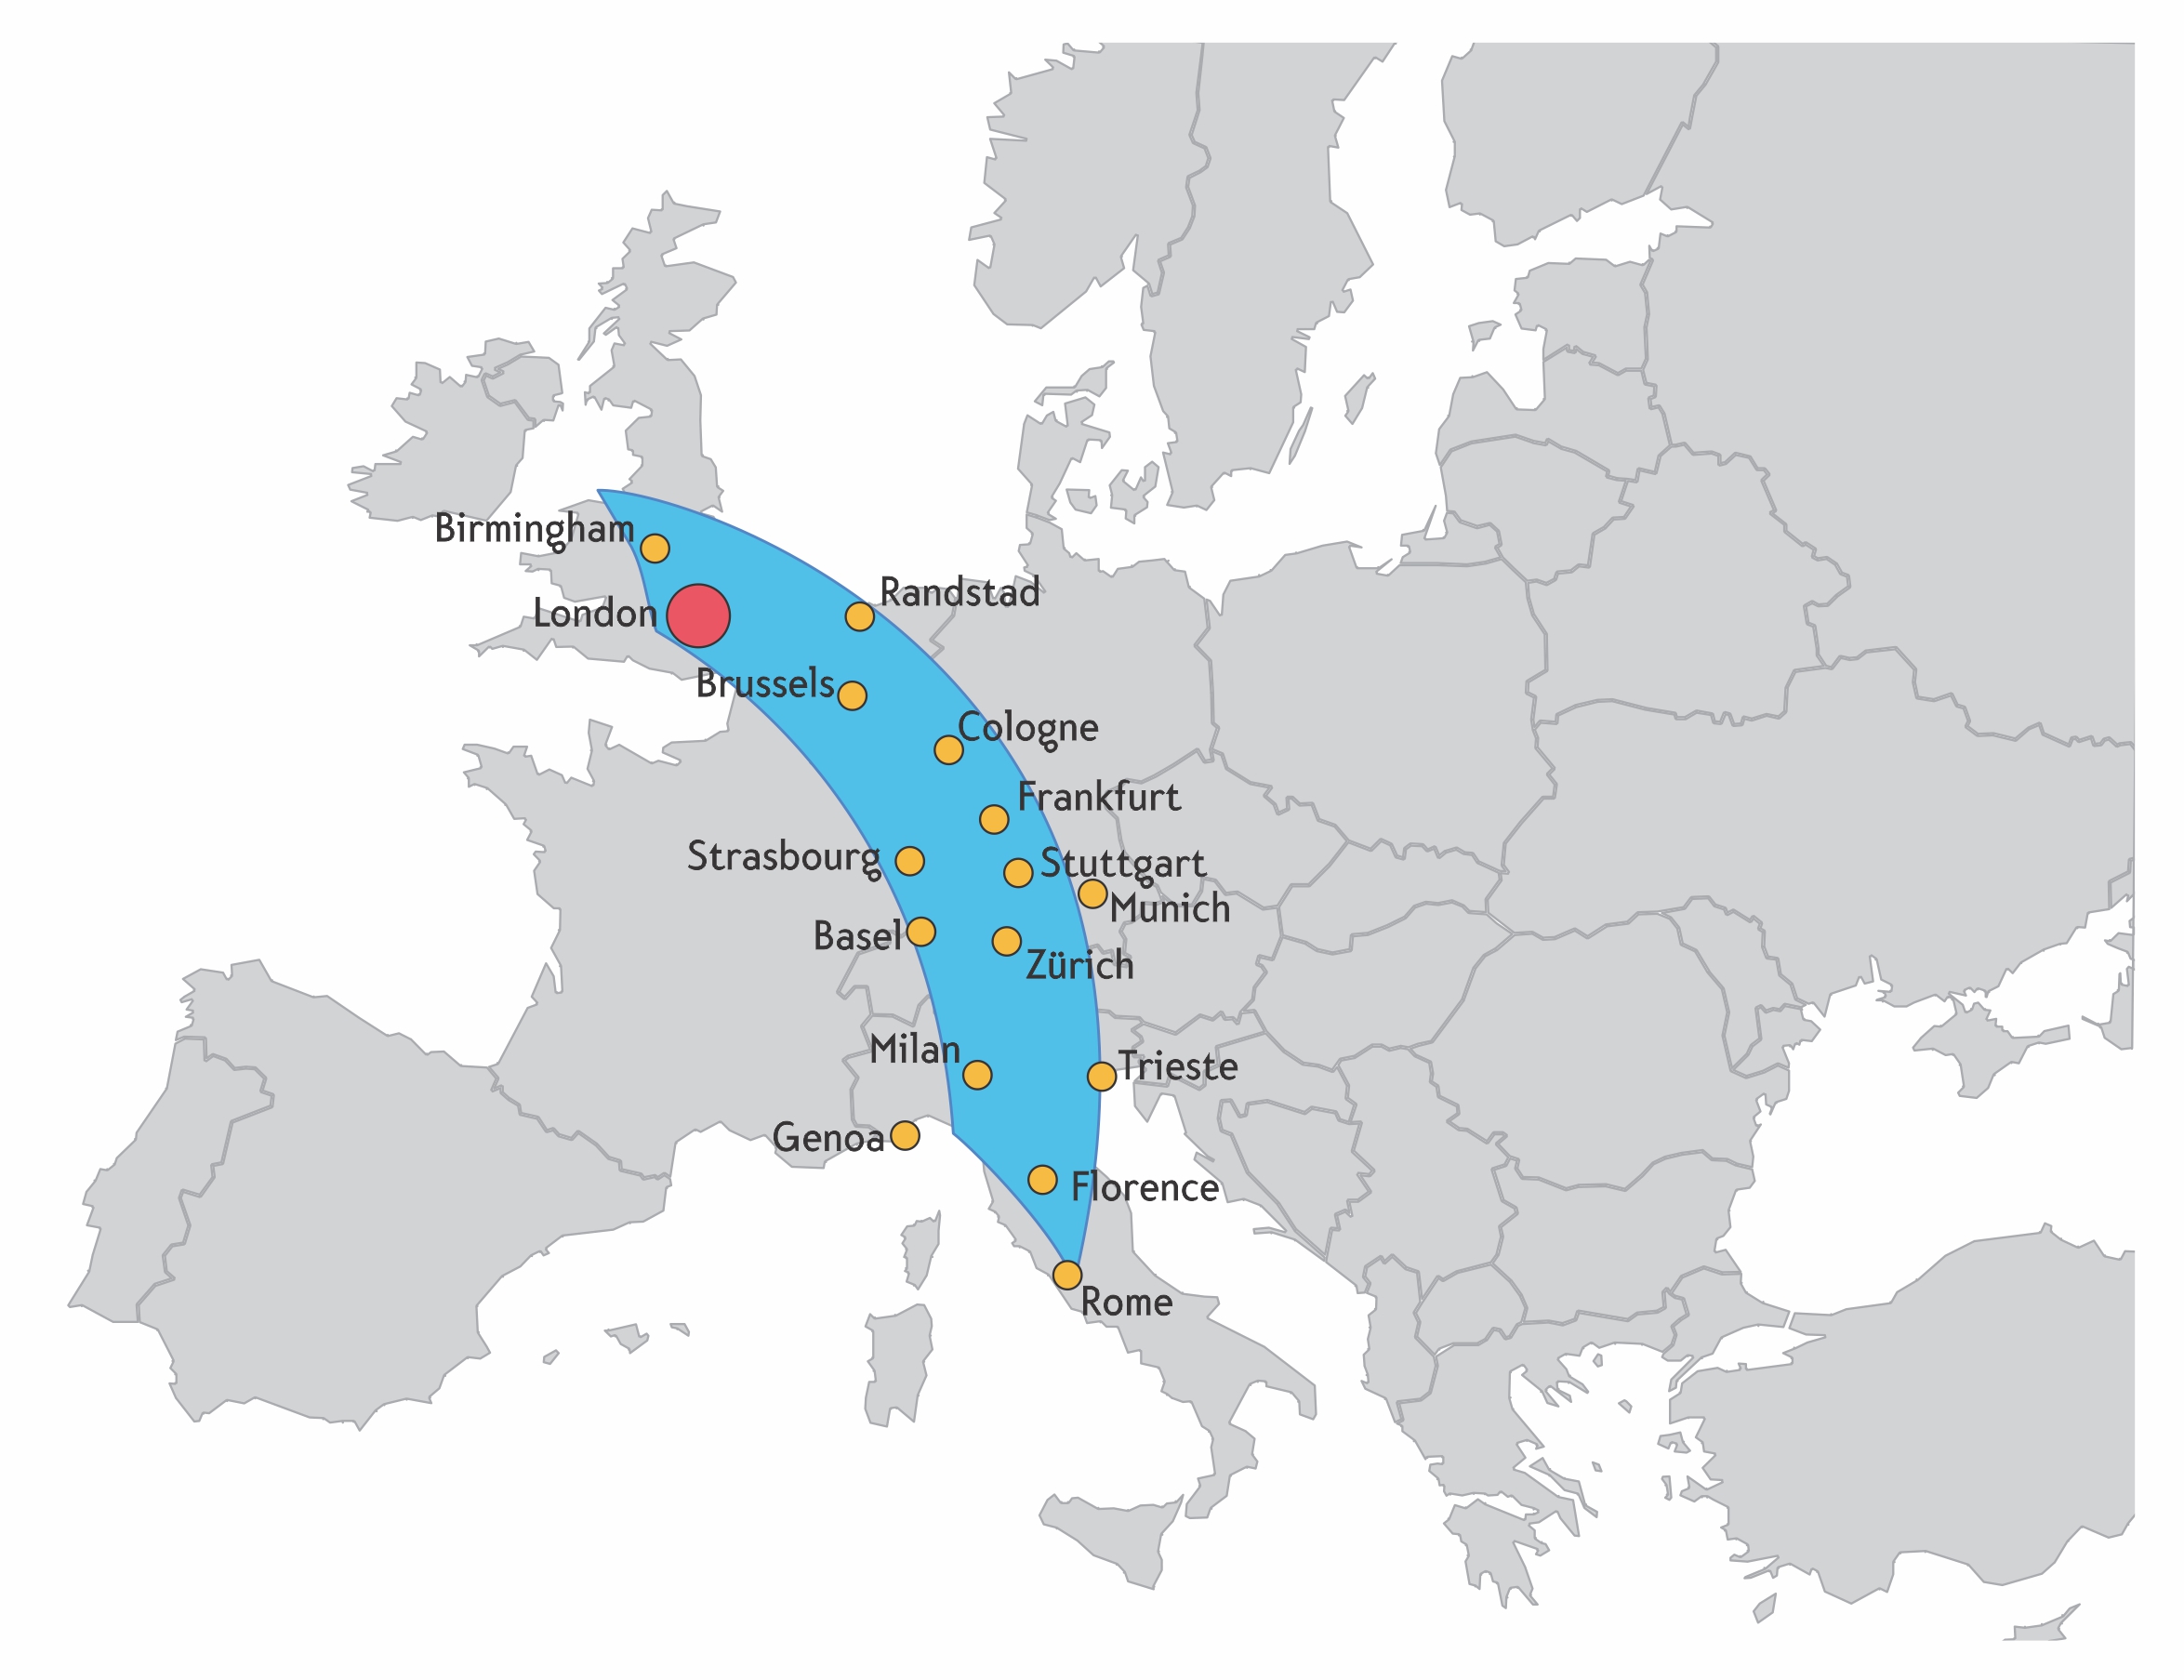
The European megalopolis.
Cartography: Royal Belgian Geographical Society (Société Royale Belge de Géographie)
Brussels is located in the northwestern part of the European continent, characterised by a high population density and significant wealth production. This privileged area, spanning from central England to northern Italy, is often referred to as the "blue banana". Ever since the Middle Ages, it has been at the heart of Western Europe's economic development.
From the second half of the 18th century onwards, the major industrial centres were concentrated in or just around this vast region, profiting in particular from the many iron and coal deposits. Brussels, located in the heart of Western Europe, was connected to the Walloon industrial areas in the 1830s via the Charleroi canal and benefited so much from this industrialisation that, in the 19th century, it became Belgium's leading industrial city.
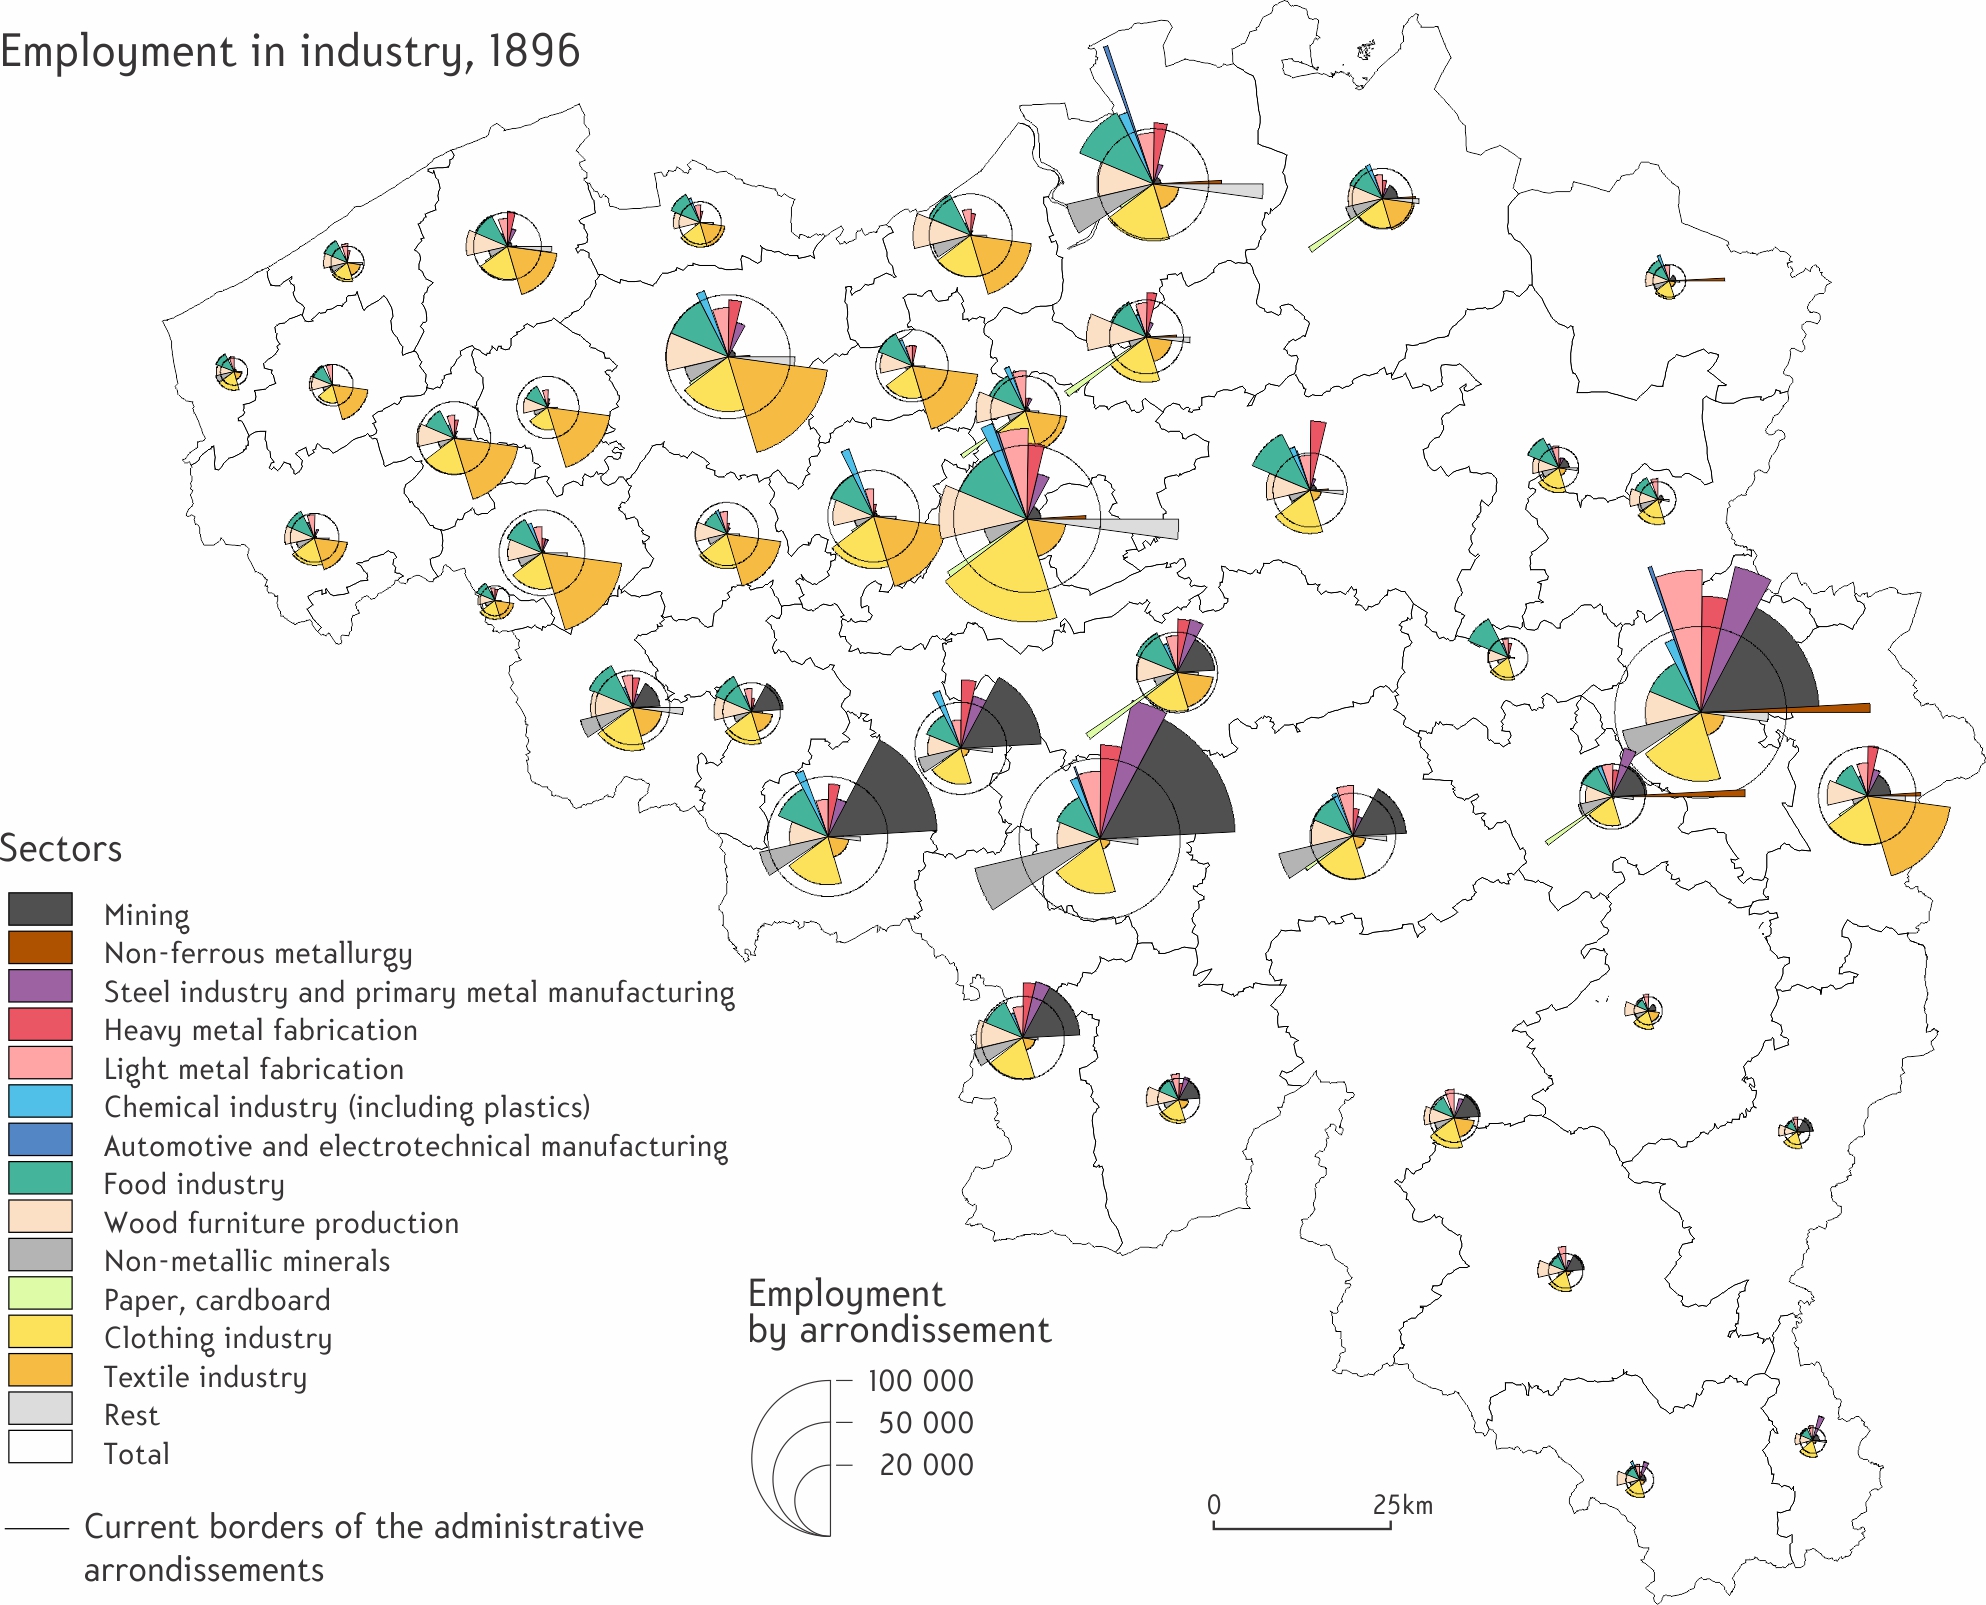
Industrial employment in Belgium in 1896 by sector of activity. Source: MÉRENNE-SCHOUMAKER Bernadette, VANDERMOTTEN Christian, VAN HECKE Etienne, DECROLY Jean-Michel, MARISSAL Pierre & VANNESTE Dominique, 2014. Atlas of Belgium - Volume 5: economic activities. Ghent: Academia Press.
The capital then began to industrially decline in the 1970s. The challenge first came from peripheral areas, which had more space to accommodate firms, followed by the global redistribution of labour (particularly moving towards Asia, the Mediterranean basin and Eastern Europe). This is shown in the industrial employment graph below, in which Brussels' curve declines earlier than that of Flanders.
As you can see in the graph, which shows the number of people working in industry over time, such employment in Brussels has been declining since the early 1970s. It followed the decline of industrial employment in Wallonia, which began some twenty years prior. In Flanders, the late industrialisation of the Kempen region ended up delaying the industrial employment decline somewhat.
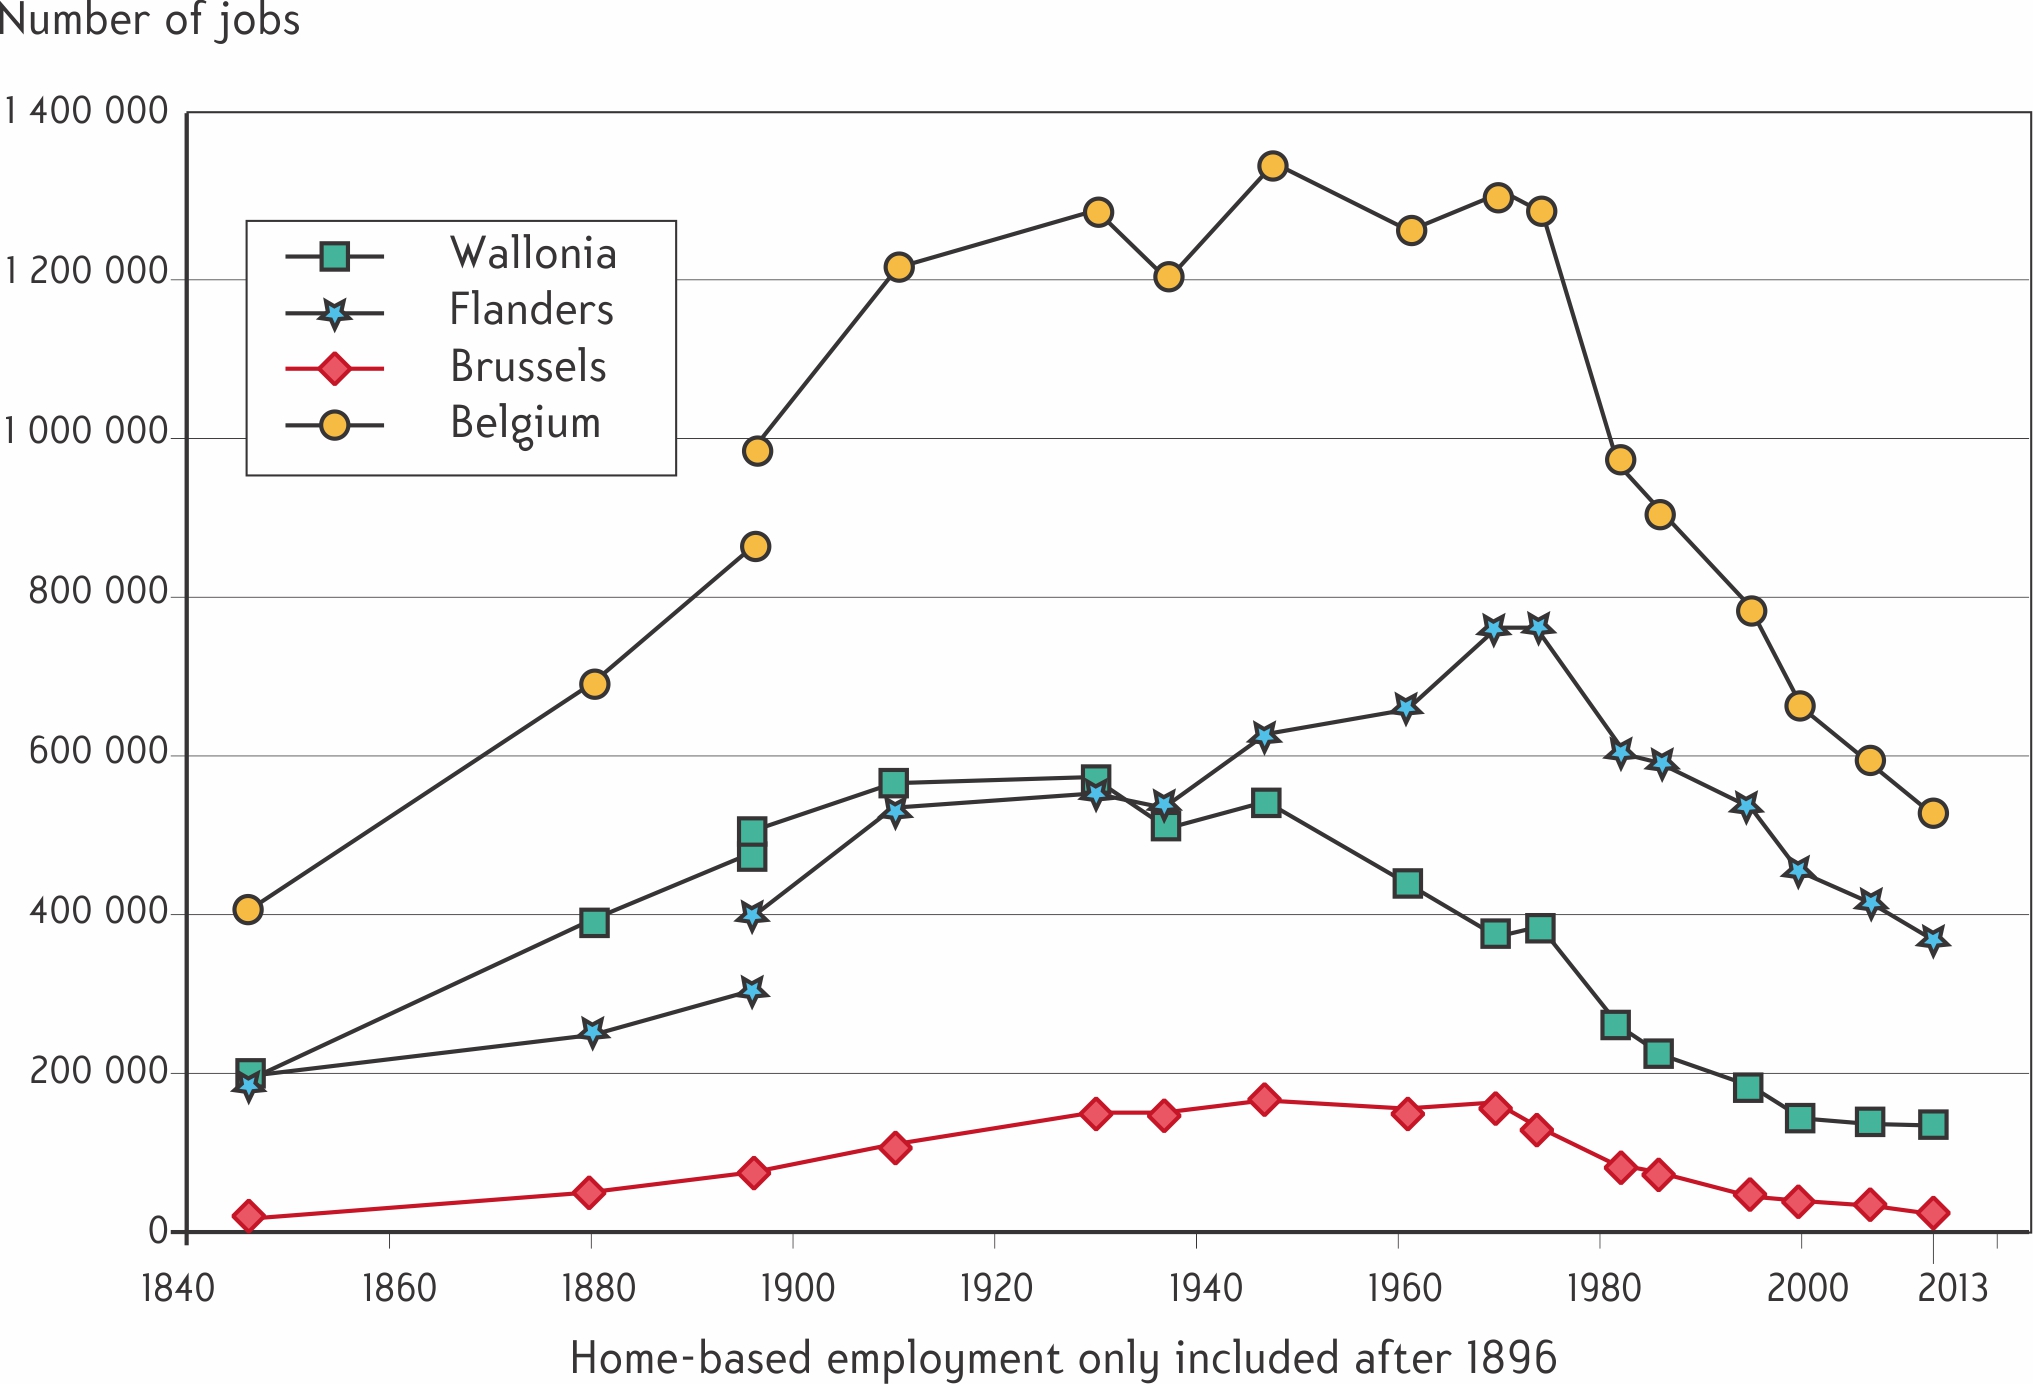
The evolution of industrial employment in Belgium (1846-2013).
Source: VANDERMOTTEN Christian, VAN HAMME Gilles, MARISSAL Pierre. La production des espaces économiques. La formation des territoires. Bruxelles, Université libre de Bruxelles, 2010, volume II, p. 50. Based on industry censuses (until 1961), National office of Social Security (ONSS) and Social Security Self-employed Entrepreneurs (INASTI) as of 1974).
The decline in industrial employment does not mean the disappearance of industry. Industrial production continues to remain important, although it is concentrated on activities with high added value. As a result, the high productivity associated with each occupation makes it possible to remain competitive with fewer workers. This pursuit of productivity has also led to a spatial reorganisation of the industrial sector, favouring vast, single-storey sites that are well connected to communication routes. The map below illustrates this shift from central industrial sites with a high concentration of workers, to peripheral sites, which are larger but much less "dense". In other words, industry is now taking up more space with fewer employees and is predominantly located in the periphery.
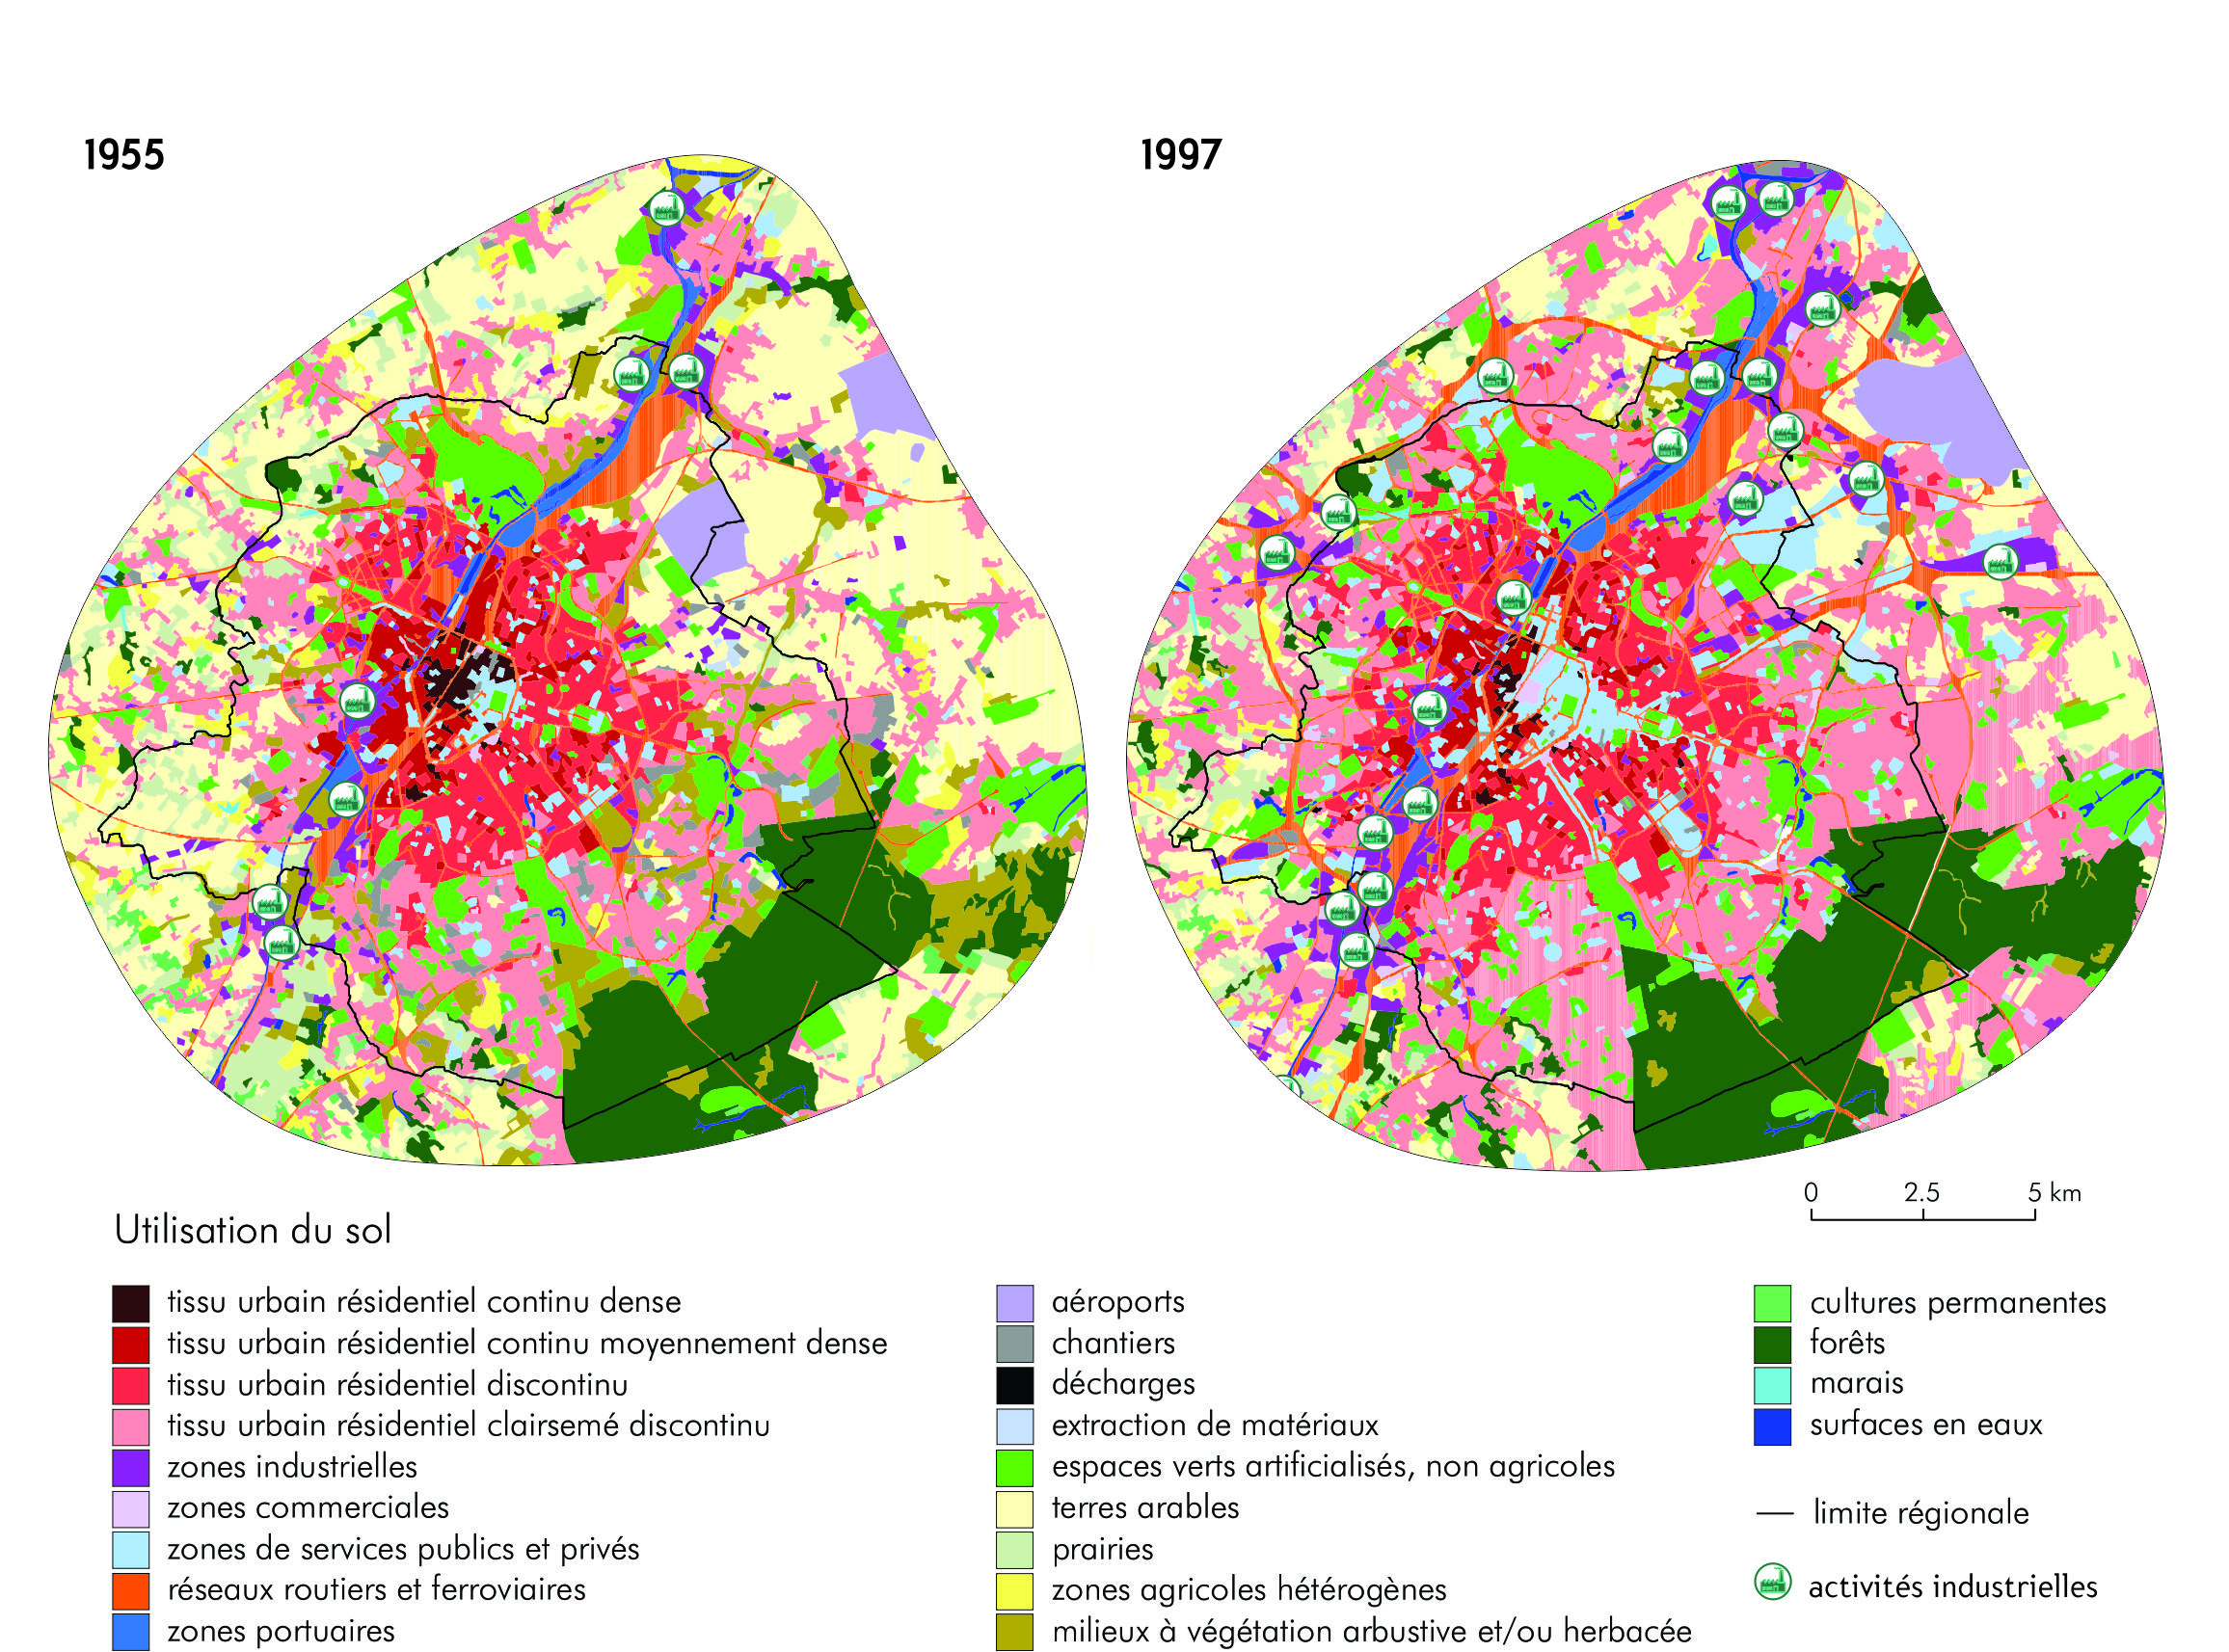
Evolution of industrial activity locations in Brussels and its periphery between 1955 and 1997. The "factory" logos illustrate the increased dispersion of the sector and the proliferation of peripheral sites. Source: VAN DEN STEEN, Isabelle, Cartographie, évolution et modélisation de l'utilisation du sol en milieu urbain. Le cas de Bruxelles. Thesis presented with a view to obtaining the title of Doctor of Science, Université libre de Bruxelles, 2005.
From the 1990s onwards, Brussels experienced a revival of its economy based on the tertiary sector and a growing interconnectivity of global networks.
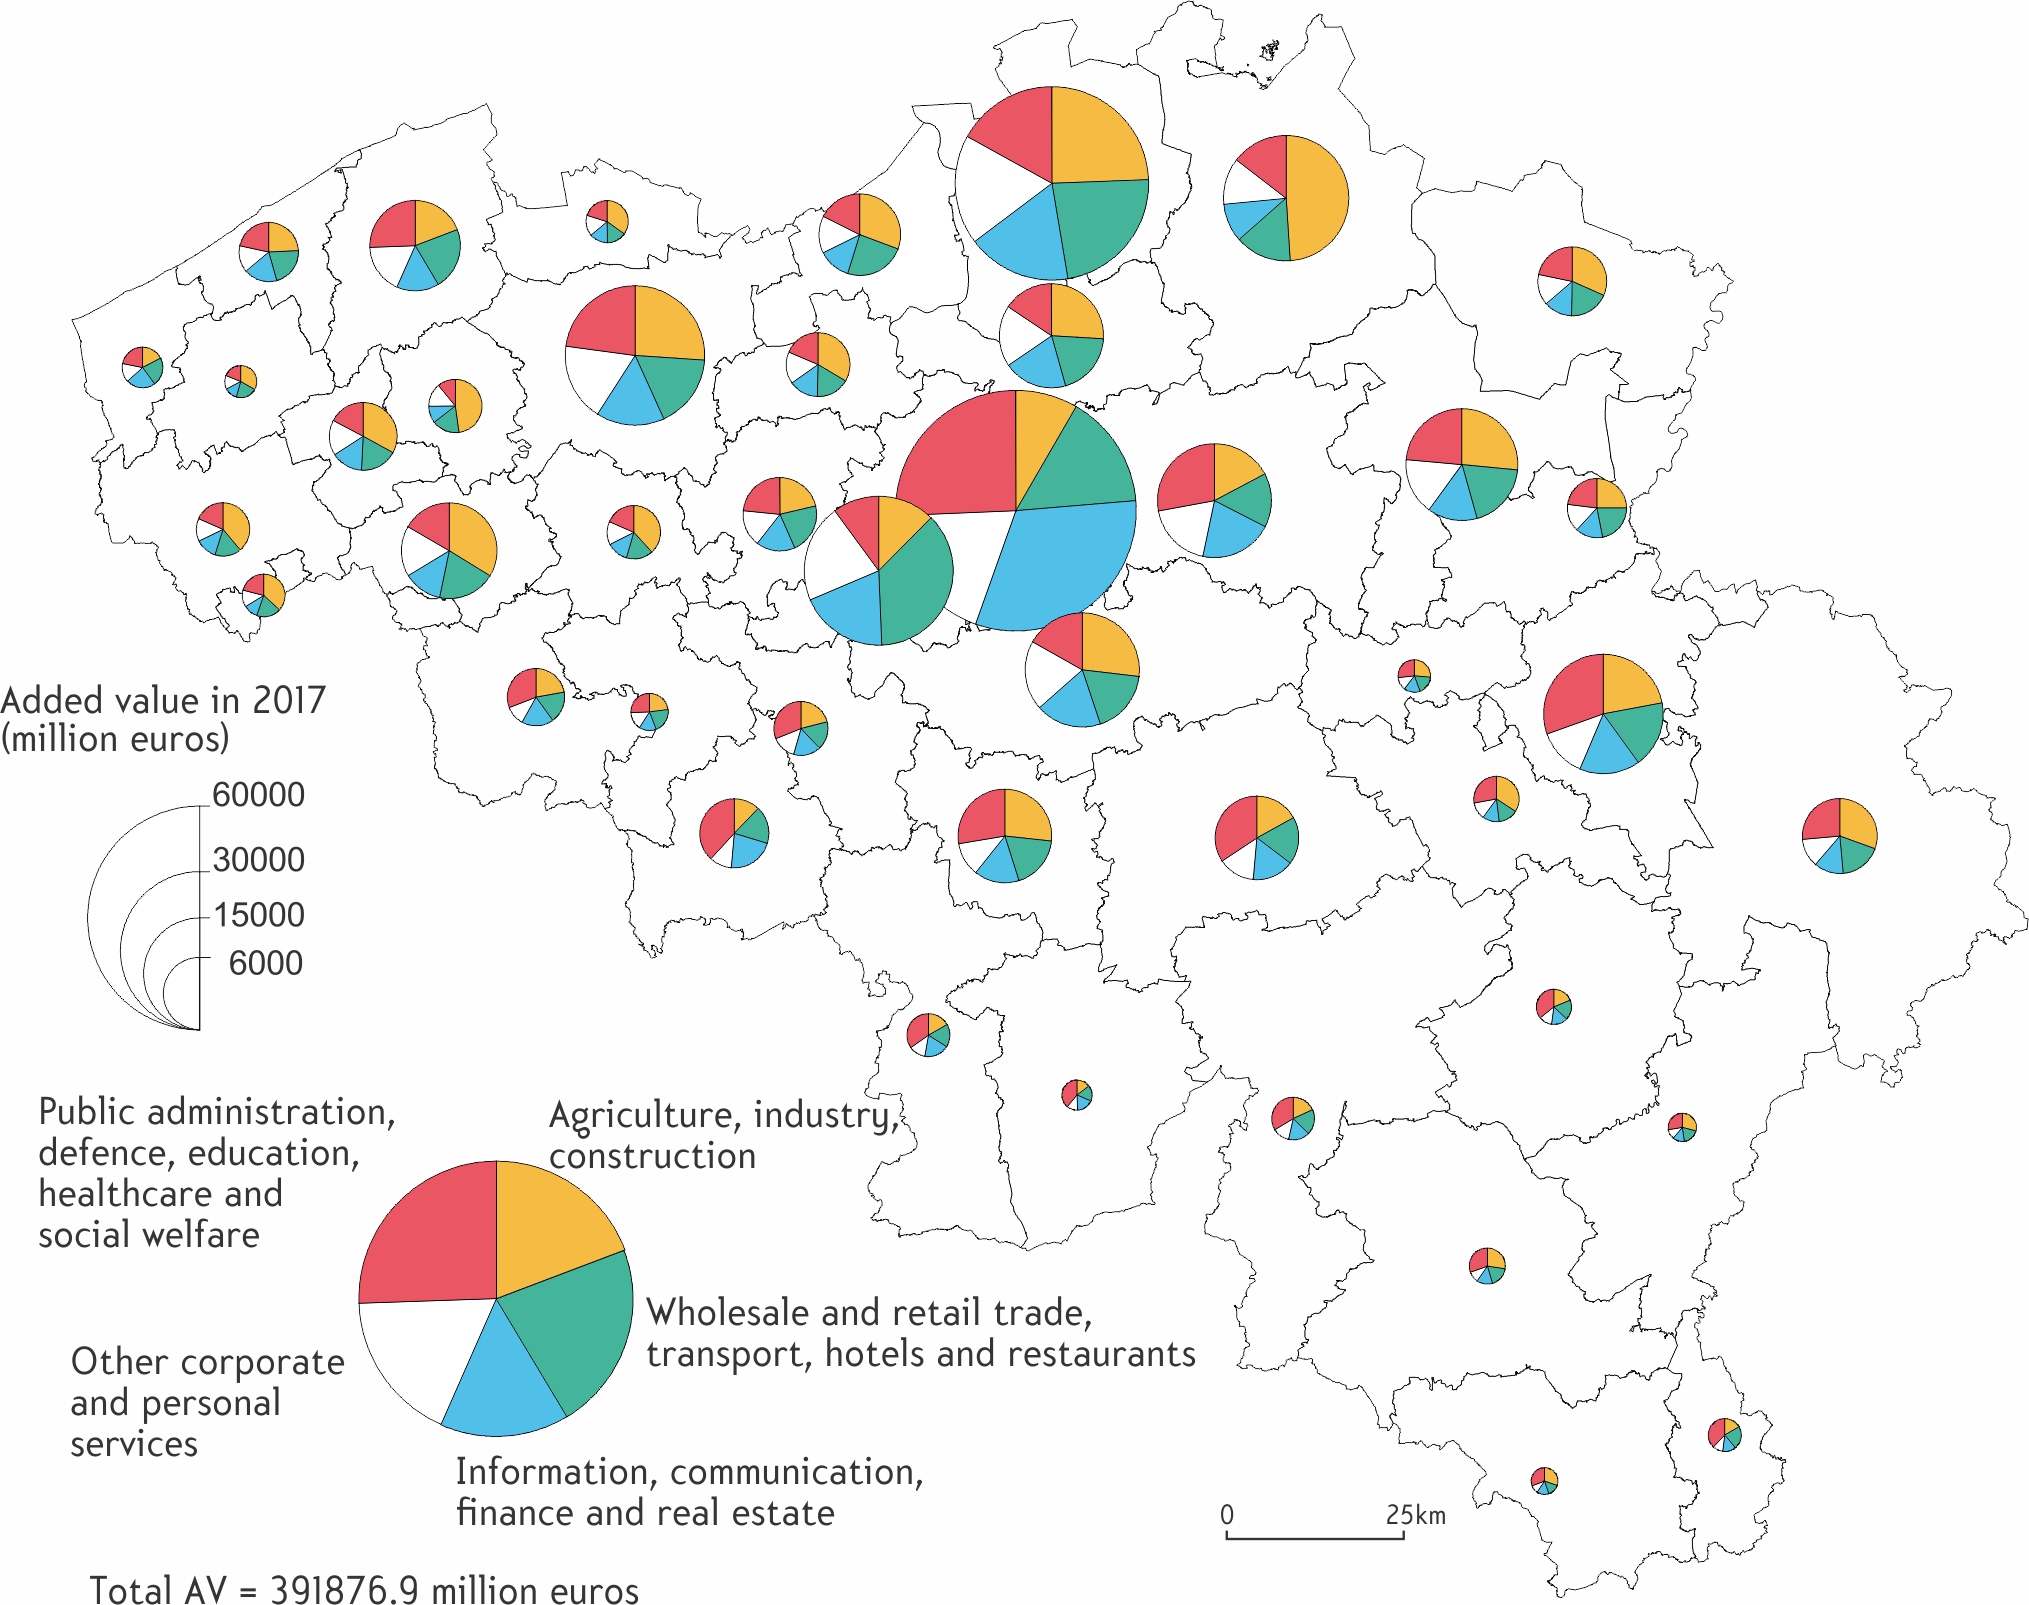
Map of employment in Belgium by activity sector (2017). Source: VANDERMOTTEN Christian, 2020. La Belgique. Presses universitaires de France. Que sais-je, 4156.
In 2017, the wealth created in Brussels mainly comes from the service sector, whose companies generate more than three quarters of Brussels' added value. This share rises to more than 90% if trade is included.
The significant weight of the public sector (including international institutions) makes Brussels seem like a city of global importance. Nevertheless, it is very small in size compared to the likes of Paris, London and Singapore. Its standing in the world economy is more comparable to Washington: very strong politically, but very modest as a command centre within the global economy. In terms of hosting company headquarters, Brussels is not even among the ten most prominent European cities. This also gives it a modest position in terms of research and development, whereby the premises are often situated close to the head offices of these companies. However, the landscape looks different if we move from the regional to the metropolitan scale (see section 1 on the different definitions of Brussels). As such, we can take into account the headquarters of several large companies (such as Toyota Europe in Zaventem), the importance of research and development in the pharmaceutical sector in Walloon Brabant (GlaxoSmithKline - GSK) and the chemical sector in Flemish Brabant (Henkel in Drogenbos, Procter & Gamble in Grimbergen). Nonetheless, Brussels boast a considerable presence of services that provide the interface between economic and political power, with all that this entails in terms of lobbyists, embassies and so on.
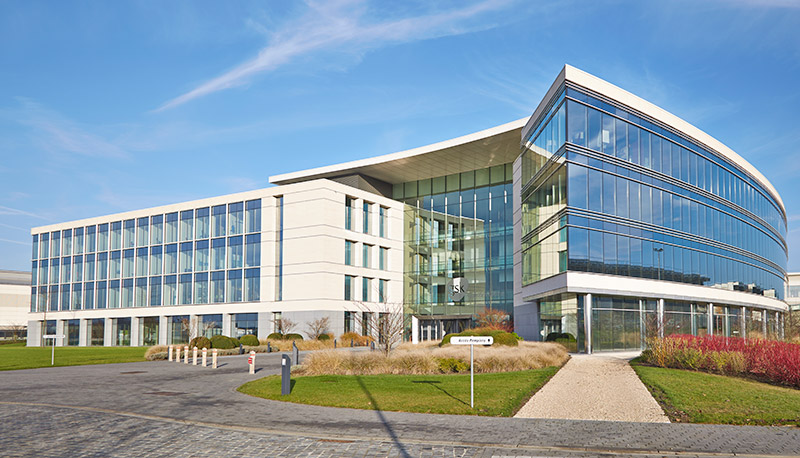
The GlaxoSmithKline (GSK) research and development centre in Wavre.
© Yannick SAS aka SAy-GSK
Thanks to these characteristics, the regional economy is experiencing ample, steady growth. The other side of the coin, however, is that relatively few jobs are created for low-skilled workers. This is one of the causes of difficulty for the Brussels-Capital Region: it creates wealth, but this is largely redistributed to the other regions where the most qualified workers live. These workers "irrigate" the employment basin which, as you can see in the map below (already analysed in section 1) extends well beyond the regional boundaries of the Brussels-Capital Region. The map stresses the extent of the daily flows of workers to the centre of Brussels, many of whom unintentionally contribute to traffic congestion.
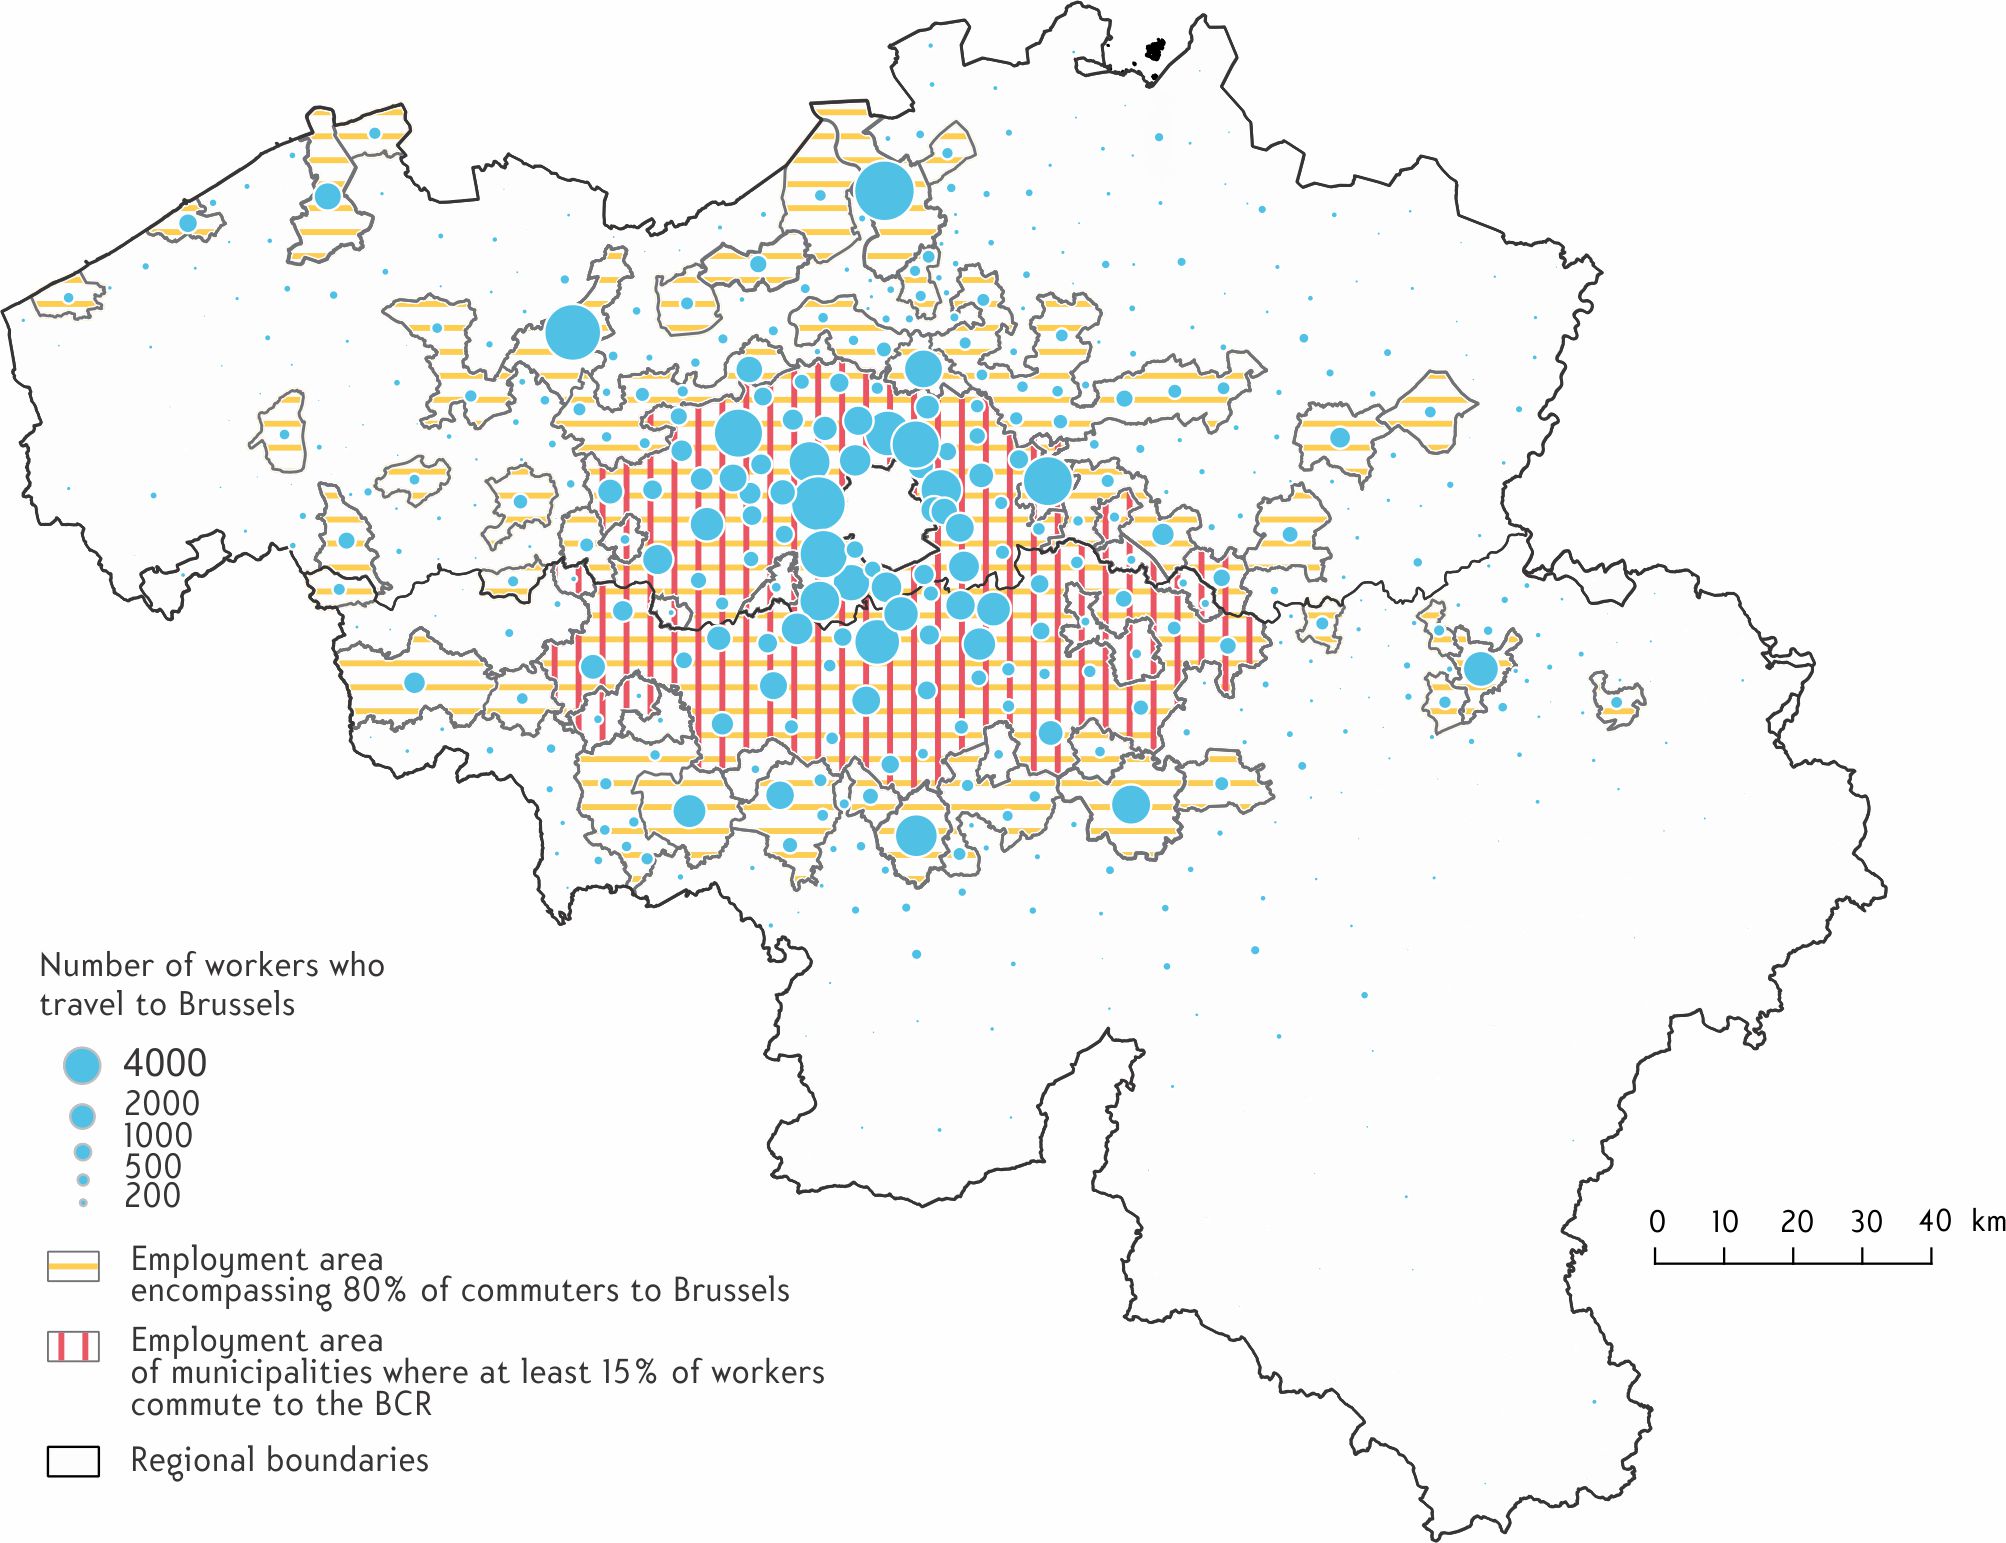
The employment basin of Brussels in 2011. Source: ERMANS Thomas, BRANDELEER Céline, D’ANDRIMONT Caroline, HUBERT Michel, LEBRUN Kevin, MARISSAL Pierre, VANDERMOTTEN Christian et WAYENS Benjamin, 2019. Analyse des déplacements domicile-travail et domicile-école en lien avec la Région de Bruxelles-Capitale. in Cahiers de l’Observatoire de la mobilité, n.6 [available online in French]. Brussels: Brussels Mobility - Brussels Regional Public Service.
Paradoxically, even though the Brussels-Capital Region boasts a prosperous economy that generates around 20% of the national GDP, it still suffers from a high unemployment rate and a population whose average income is significantly below the Belgian average. The Region actually only (directly) benefits from 8.5% of the national tax revenue, since this is primarily collected according to place of residence and, as you have just seen, a significant proportion of people working in Brussels are commuters who live outside the Region.
The following map illustrates this phenomenon well, showing the tax revenues in Belgium in 2017. If you look closely, you will notice the lighter patch of the Brussels Capital Region, where the median income is indeed much lower than in its immediate periphery.
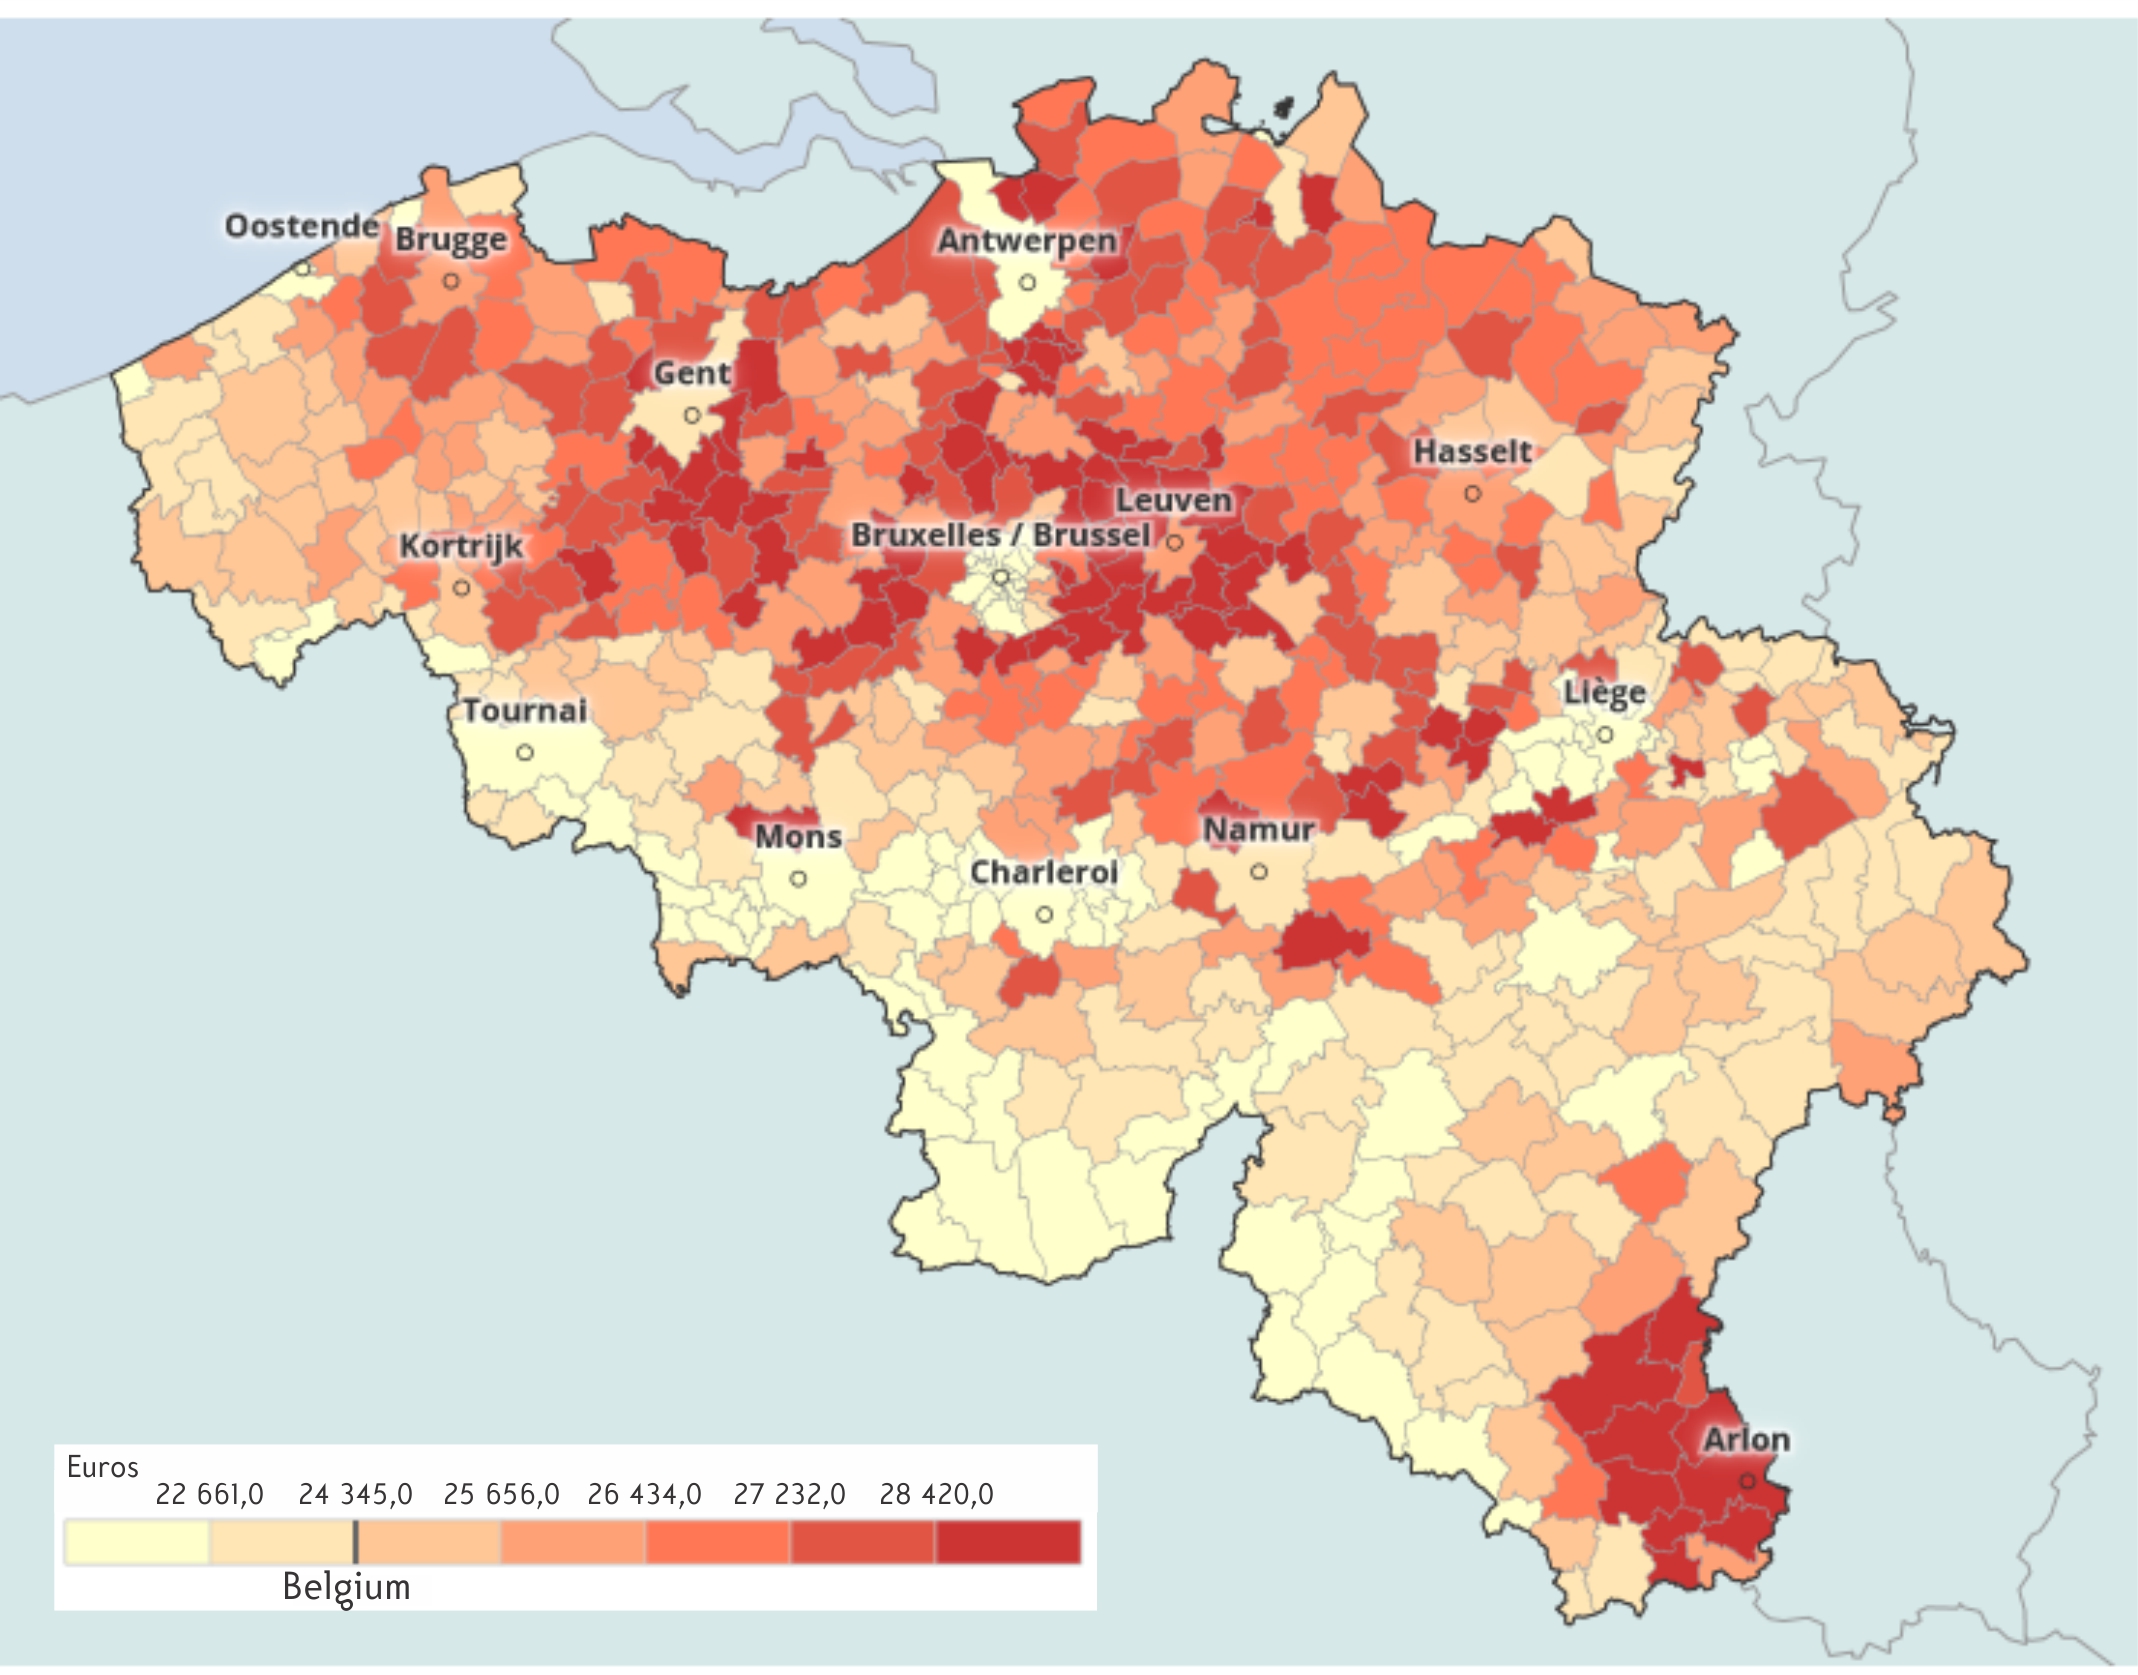
Map of tax income in Belgium (median income by declaration).
Source: Digital Atlas of Belgium according to Statbel, 2017.
Do you have a suggestion, comment or remark about this activity? Click here!