Activity 6: The political participation of Brussels citizens of foreign origin

Brussels, the second most cosmopolitan city in the world?
Activity 6: The political participation of Brussels citizens of foreign origin
Although, as you have just seen, people of foreign origin in Brussels suffer various forms of discrimination (in access to housing, recruitment, employment, etc.), they are now relatively well represented at the political level, both at municipal and regional level.
The acquisition of voting rights for foreign residents
Since 2000, Brussels citizens who are nationals of an EU Member State have had the right to vote and to stand for election at municipal level. Only in 2004 did Brussels citizens of non-European Union nationality obtain the right to vote in municipal elections provided that they meet a series of additional conditions (i.e. reside in Belgium for at least five years, have a valid residence permit, be registered in the population or foreigners register, and honour their commitment to respect the Belgian Constitution and the European Convention on Human Rights). They were able to vote for the first time in the 2006 municipal elections.
Take a close look at the leaflet below inviting residents of European nationality to vote in the 2018 municipal elections in Brussels.
Despite stricter conditions, Brussels residents of non-European nationality tend to participate more actively in local politics than European residents, even in municipalities where the latter form a large part of the population, such as Etterbeek and Ixelles/Elsene. In the table below, you can see the "Top 5" in terms of the political participation of people who did not have Belgian nationality during the last municipal elections in 2018 in Brussels.
The electoral participation of foreigners according to their nationality in the last municipal elections of 2018 in Brussels
 Guinea Guinea |
30% |
| 30% of people of Guinean nationality in Brussels were registered to vote in 2018. | |
 Germany Germany |
29% |
| 29% of people of German nationality in Brussels were registered to vote in 2018. | |
 The DROC1 The DROC1 |
25% |
| 25% of people of Congolese nationality in Brussels were registered to vote in 2018. | |
 Algeria Algeria |
25% |
| 25% of people of Algerian nationality in Brussels were registered to vote in 2018. | |
 The Netherlands The Netherlands |
24% |
| 24% of people of Dutch nationality in Brussels were registered to vote in 2018. |
1Democratic Republic of the Congo
Article published by Véronique Lamquin and Cédric Petit in the newspaper Le Soir. Published on 23/10/2018 and available online. The figures are calculated on the basis of the figures published by the Ministry of the Interior for the Belgian municipalities and on the population data published by IBSA.
Of the five most active nationalities in the last communal elections, three of them are therefore not members of the European Union (Guinea, the Democratic Republic of the Congo and Algeria). In terms of active citizenship, Europeans living at the very heart of the European Union therefore seem to be less active than some non-Europeans.
The exercise of political mandates by people of foreign origin
Remember that today only Belgian citizens (and for local elections also European citizens) have the right to stand for election. However, since the mid-1990s, an interesting phenomenon has been observed in Brussels: an increase in the number of Belgian citizens of non-European origin who run in the various elections (local, regional, legislative, European) and who succeed in getting themselves elected or even in integrating certain executive bodies. This strong political representation makes Brussels a unique case both on the European and world stage.
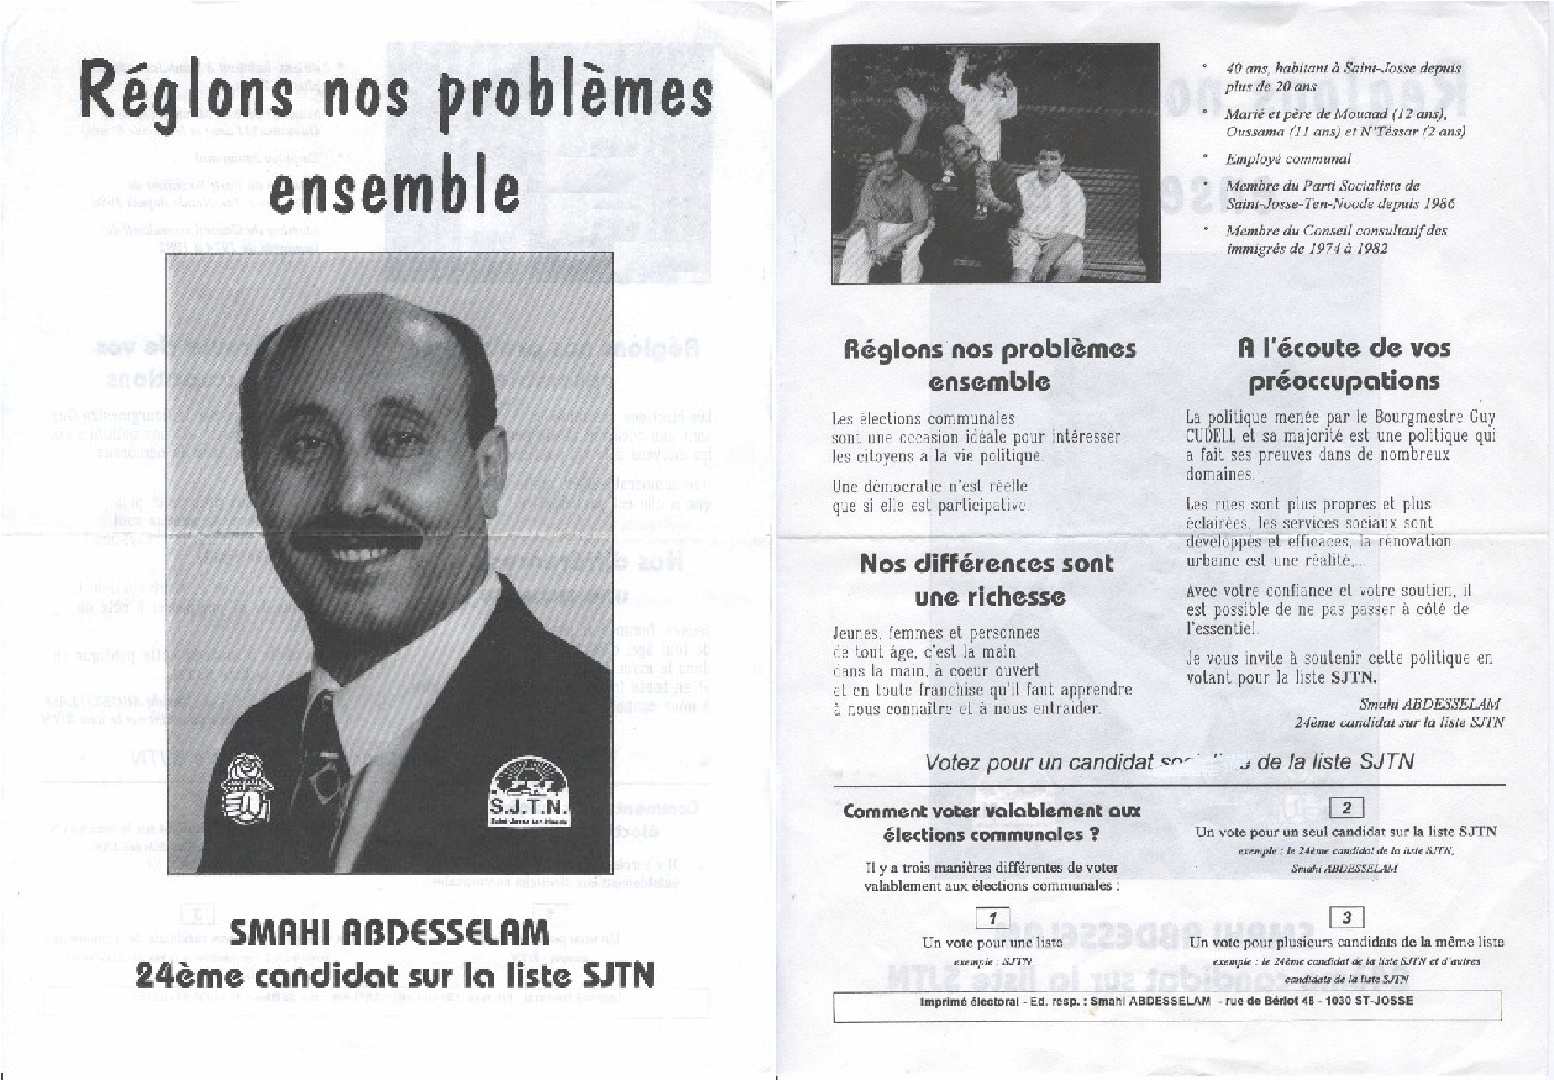
Tract of Smahi Abdesselam, candidate in the communal elections of Saint-Josse-Ten-Noode in 1994, at the end of which he was one of the first three elected representatives of foreign origin to sit in his municipal council. © Tractothèque
The municipal elections of 2000 marked a turning point in the political participation of citizens of foreign origin in the Brussels-Capital Region, as shown in the following table. If you look closely, you will certainly notice the sharp increase in the proportion of councillors of foreign origin from 2000 onwards.
Number and proportions of elected representatives of non-European origin in the municipal elections in the Brussels-Capital Region from 1994 to 2018.
| Year of the municipal election |
Municipal councillors of foreign origin (non-EU nationals) |
Total of municipal councillors in the 19 municipalities of the Brussels-Capital Region | Proportion of advisers of foreign origin (non-EU nationals) |
| 1994 | 14 | 651 | 2,1 % |
| 2000 | 90 (mainly of Moroccan origin) |
652 | 13,8 % |
| 2006 | 138 (mainly of Moroccan origin, but also of Turkish and Congolese origin.) |
663 | 20,8 % |
| 2012 | 161 | 685 | 23,5 % |
| 2018 | (data not yet available) | (data not yet available) | (data not yet available) |
Figures from 1994 to 2006: REA A, 2012, p. 262. It is important to read this table bearing in mind that ethnic statistics in Belgium are prohibited. The figures shown here are therefore not official figures collected by the Belgian state, but a manual calculation based on surnames. Figures for 2012: articles from La Libre Belgique and le Vif.
At the executive level, it is in the Brussels municipality of Saint-Josse/Sint-Joost that the first mayor of foreign origin was appointed in 2012. In the following municipal elections (2018), four mayors of foreign origin were elected to head their municipality (in Saint-Josse/Sint-Joost, Ixelles/Elsene, Ganshoren and Koekelberg). The same observations can be made at the level of regional elections. An increasing number of Belgian citizens of non-European origin have been elected to the Parliament of the Brussels-Capital Region.
Number and proportions of elected representatives of non-European origin in the elections to the Parliament of the Brussels-Capital Region from 1995 to 2019
| Year of the regional election | Parliamentarians of foreign origin (non-EU nationals) | Total CBR parliamentarians | Proportion of parliamentarians of foreign origin (non-EU nationals) |
| 1995 |
5 |
75 | 6,6 % |
| 1999 |
8 |
75 | 10,6 % |
| 2004 | 21 | 89 | 23,5 % |
| 2009 |
26 |
89 |
29,2 % |
| 2014 |
21 |
89 |
23,5 % |
| 2019 |
30 |
89 |
33,7 % |
Source: website managed by Pierre-Yves Lambert "Suffrage Universel ", view online. Since ethnic statistics in Belgium are prohibited, the figures presented here are therefore not official figures collected by the Belgian state, but a manual calculation that is still under construction.
For the first time in 2004, a Belgian politician of non-European origin, Emir Kir, was appointed Secretary of State (a sort of "deputy minister").
How can the political representation of Belgians of foreign origin in Brussels be explained?
Some municipalities have experienced a significant diversification of their population, as you have already seen. The political parties active in these municipalities have therefore opened up their electoral lists to these "new Belgians" in order to continue to reflect the population of the municipality, and thereby maintain themselves politically. For the French-speaking parties, the vote of this new electorate, which was fluent in French, also constituted a stake in their competition with the Dutch-speaking parties, which as a result, also prompted them to propose candidates of foreign origins in order to capture this new electorate.
Finally, some researchers also explain the political representation of people of foreign origin through the ''preference vote'': in Belgium, one can vote for a political list and/or for certain candidates of this list in particular. It appears that some people vote more easily for candidates whom they feel they share the same origins, religion or ethnicity. Some candidates consequently call on their community to vote for them on the basis of ethnic, religious or linguistic criteria, this is what is known as the 'ethnic vote', a very sensitive issue on the Belgian political scene. However, candidates of foreign origin are not elected exclusively by the votes of their community (Teney C, Jacobs D, Rea A, Delwit P, 2013).
A compilation of election leaflets encouraging " the ethnic vote ".
Move the blue cursor under the image to discover some examples of these leaflets!
Do you have a suggestion, comment or remark about this activity? Click here!